Better DevOps practices for for high performing software teams
A presentation at DevOps Talks - Sydney 2022 in in Sydney NSW, Australia by Jeremy Meiss
Better DevOps practices for for high performing software teams

Jeremy Meiss Director, DevRel & Community

“
performance described vs performance derived
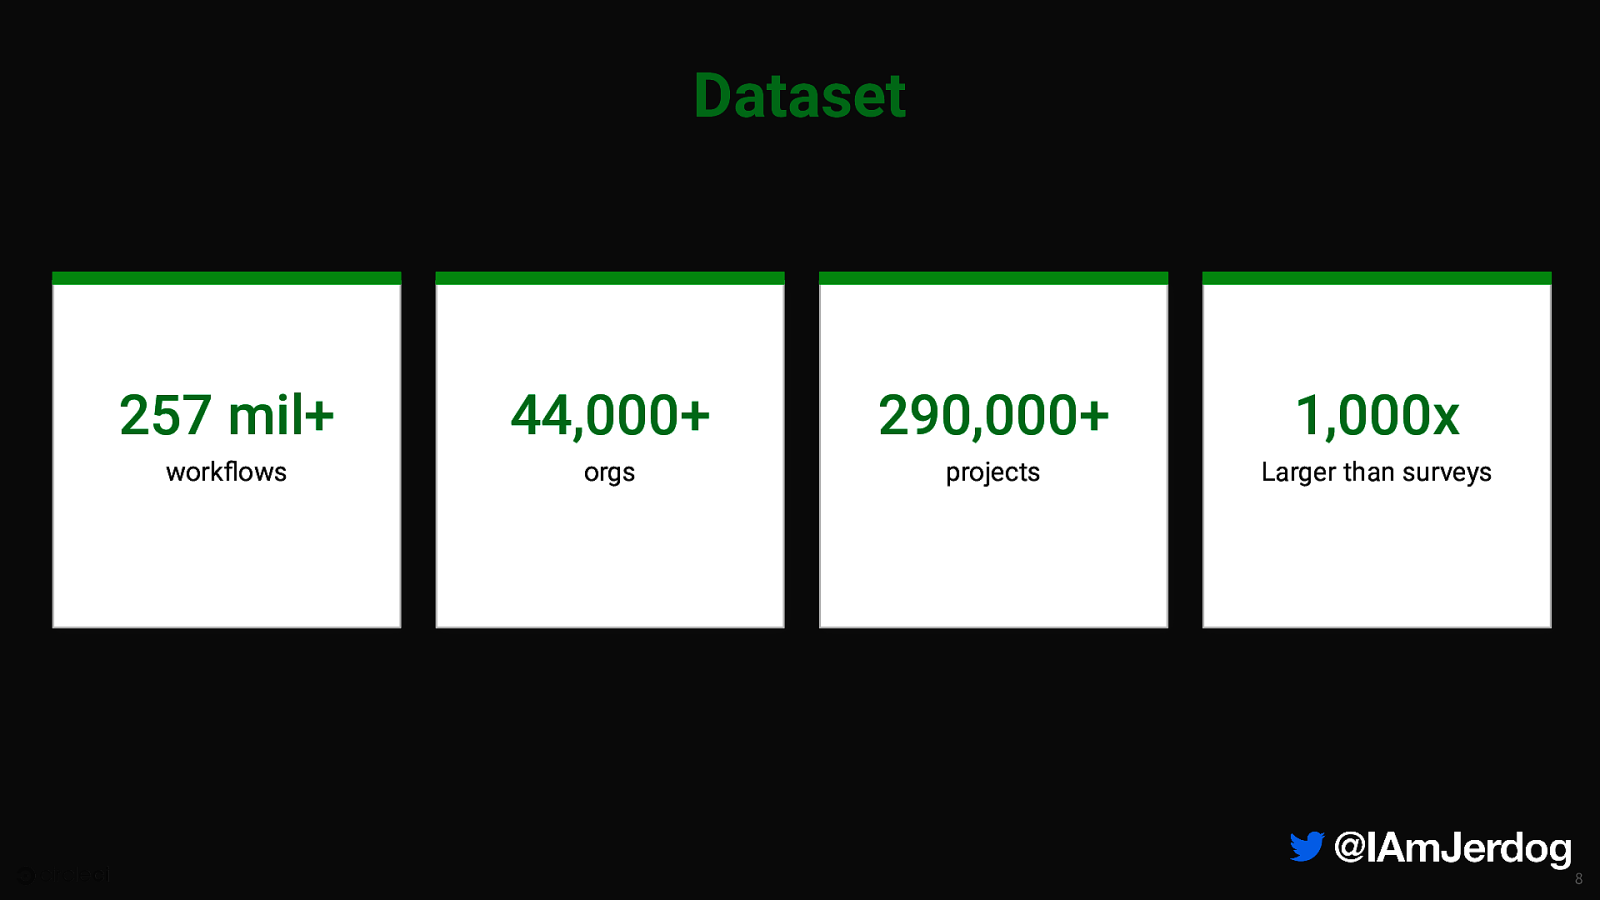
Dataset 257 mil+ 44,000+ 290,000+ 1,000x workflows orgs projects Larger than surveys 8

Image: Risk Culture
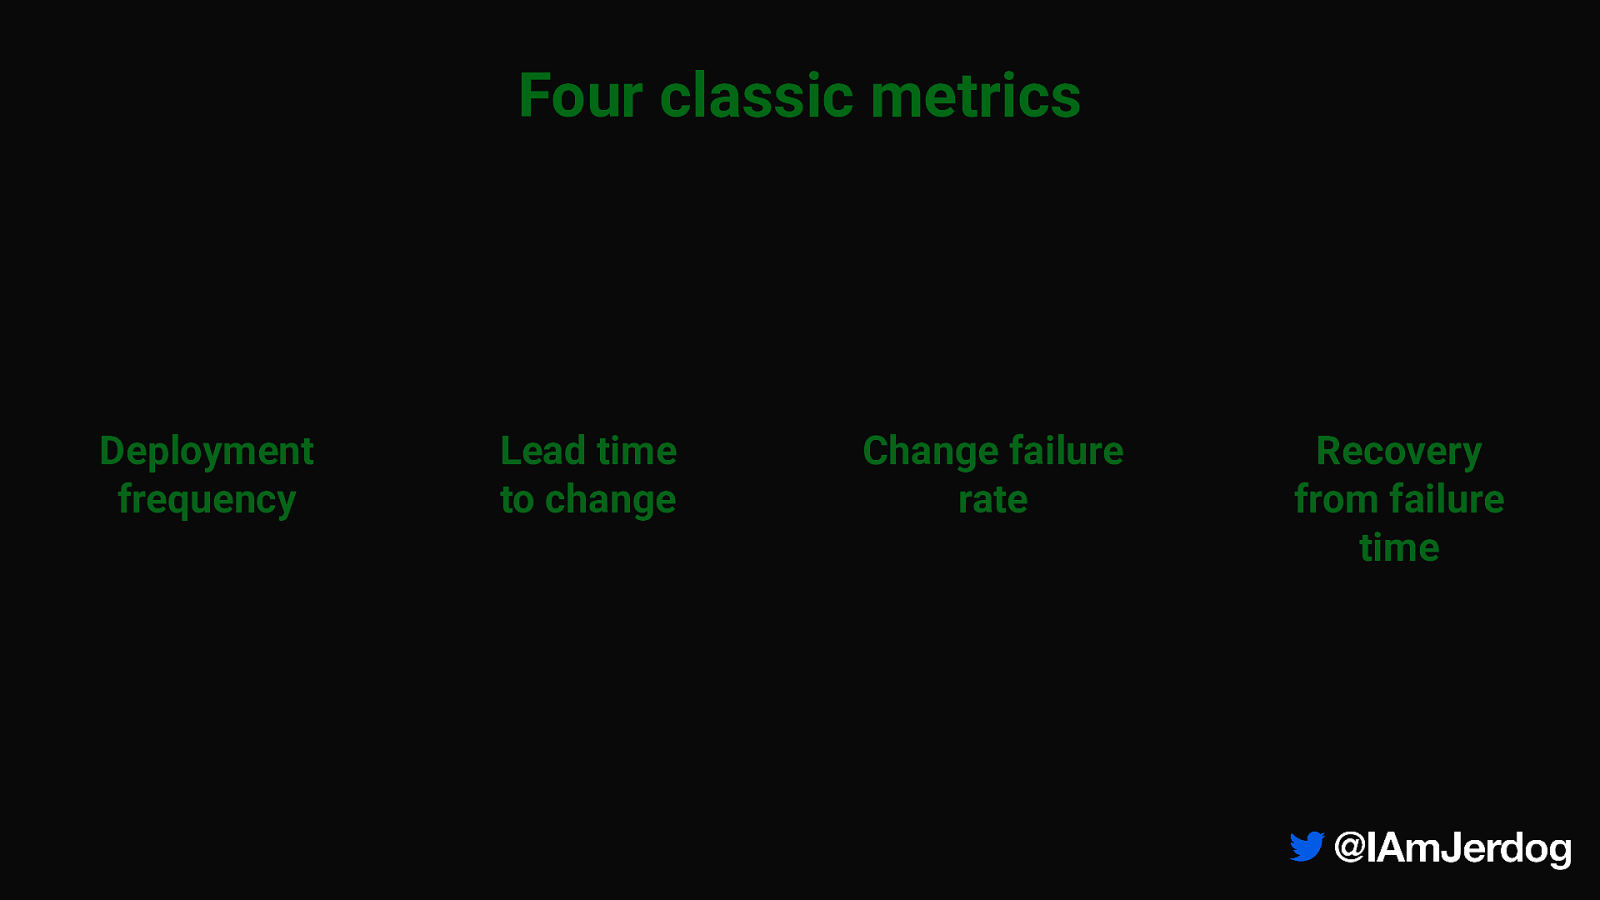
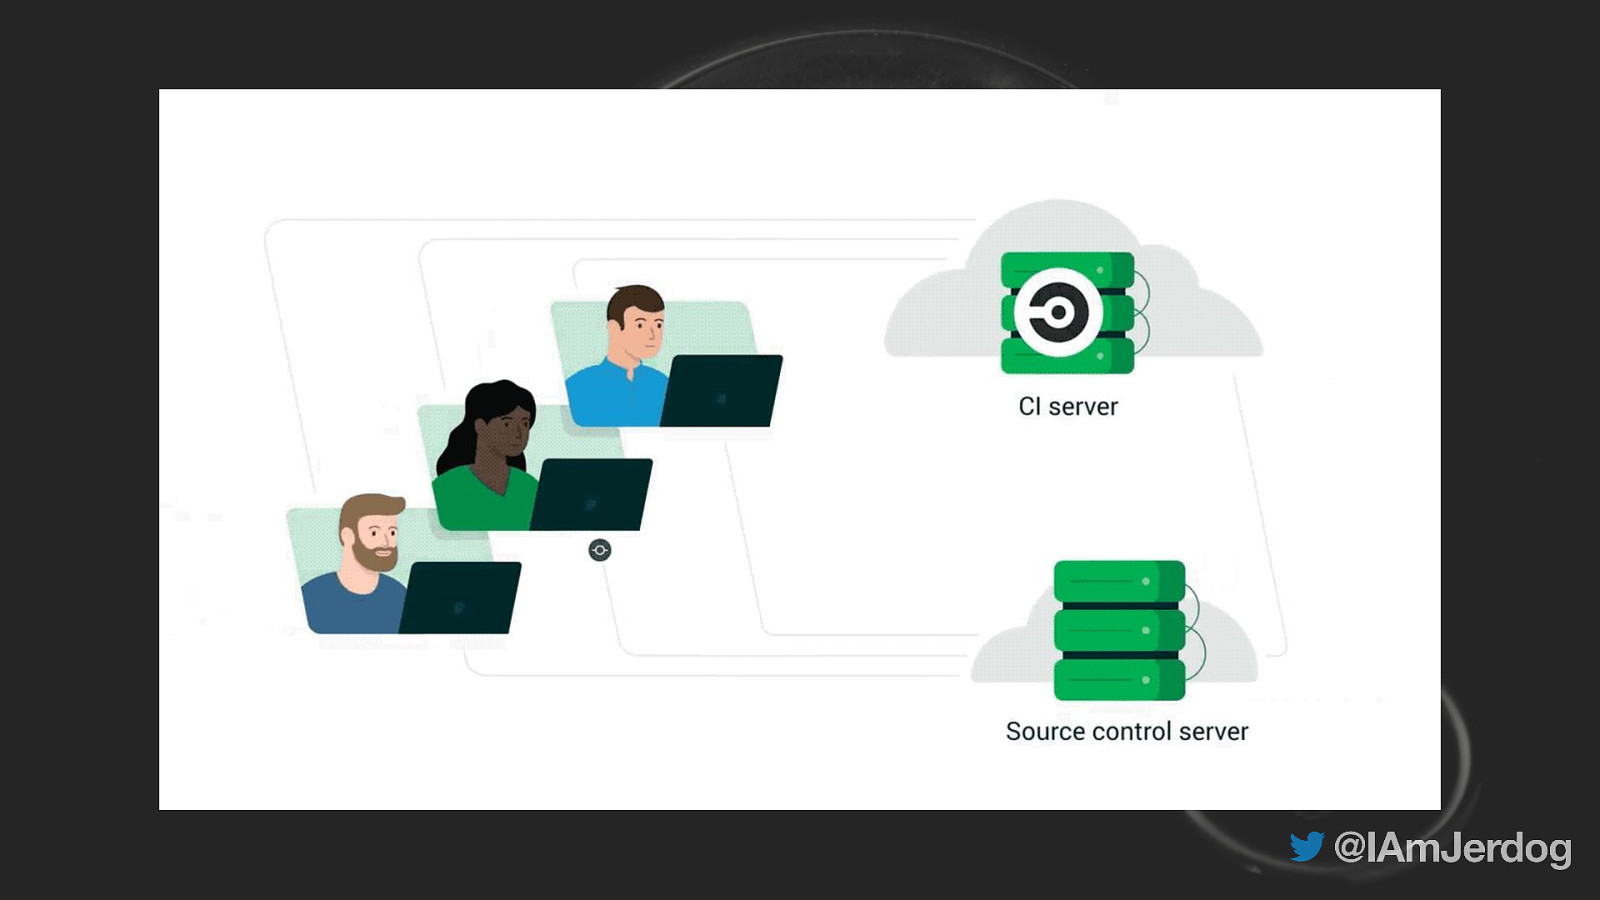
Four classic metrics Deployment frequency Lead time to change Change failure rate Recovery from failure time
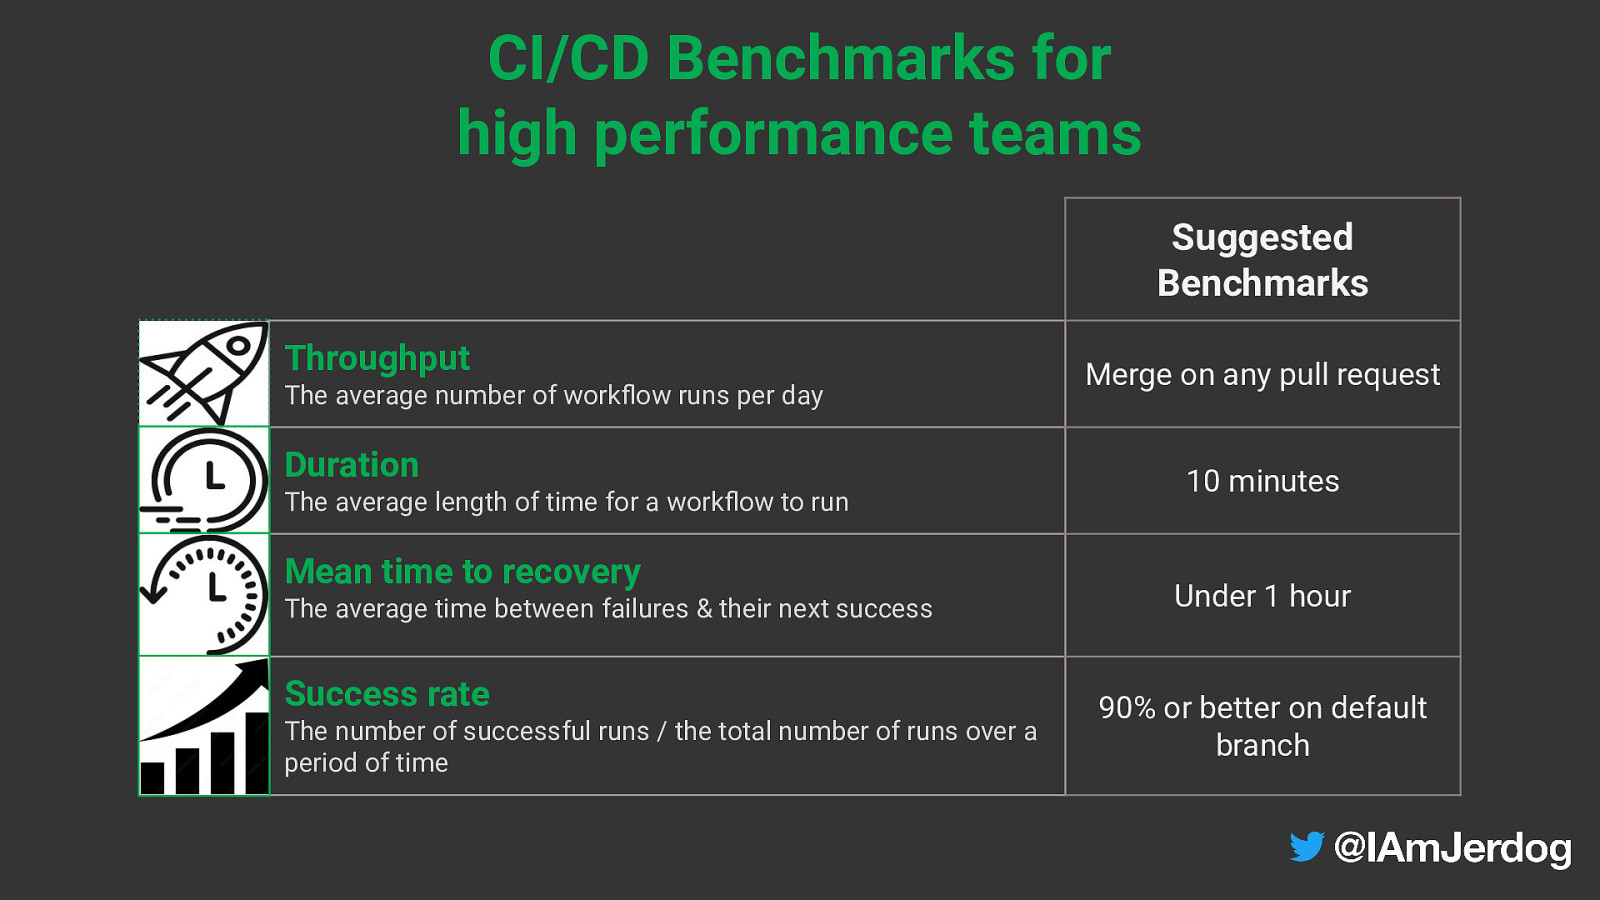
CI/CD Benchmarks for high performance teams Suggested Benchmarks Throughput The average number of workflow runs per day Duration The average length of time for a workflow to run Mean time to recovery The average time between failures & their next success Success rate The number of successful runs / the total number of runs over a period of time Merge on any pull request 10 minutes Under 1 hour 90% or better on default branch

12

The Data

Photo by: Matthew Henry 14
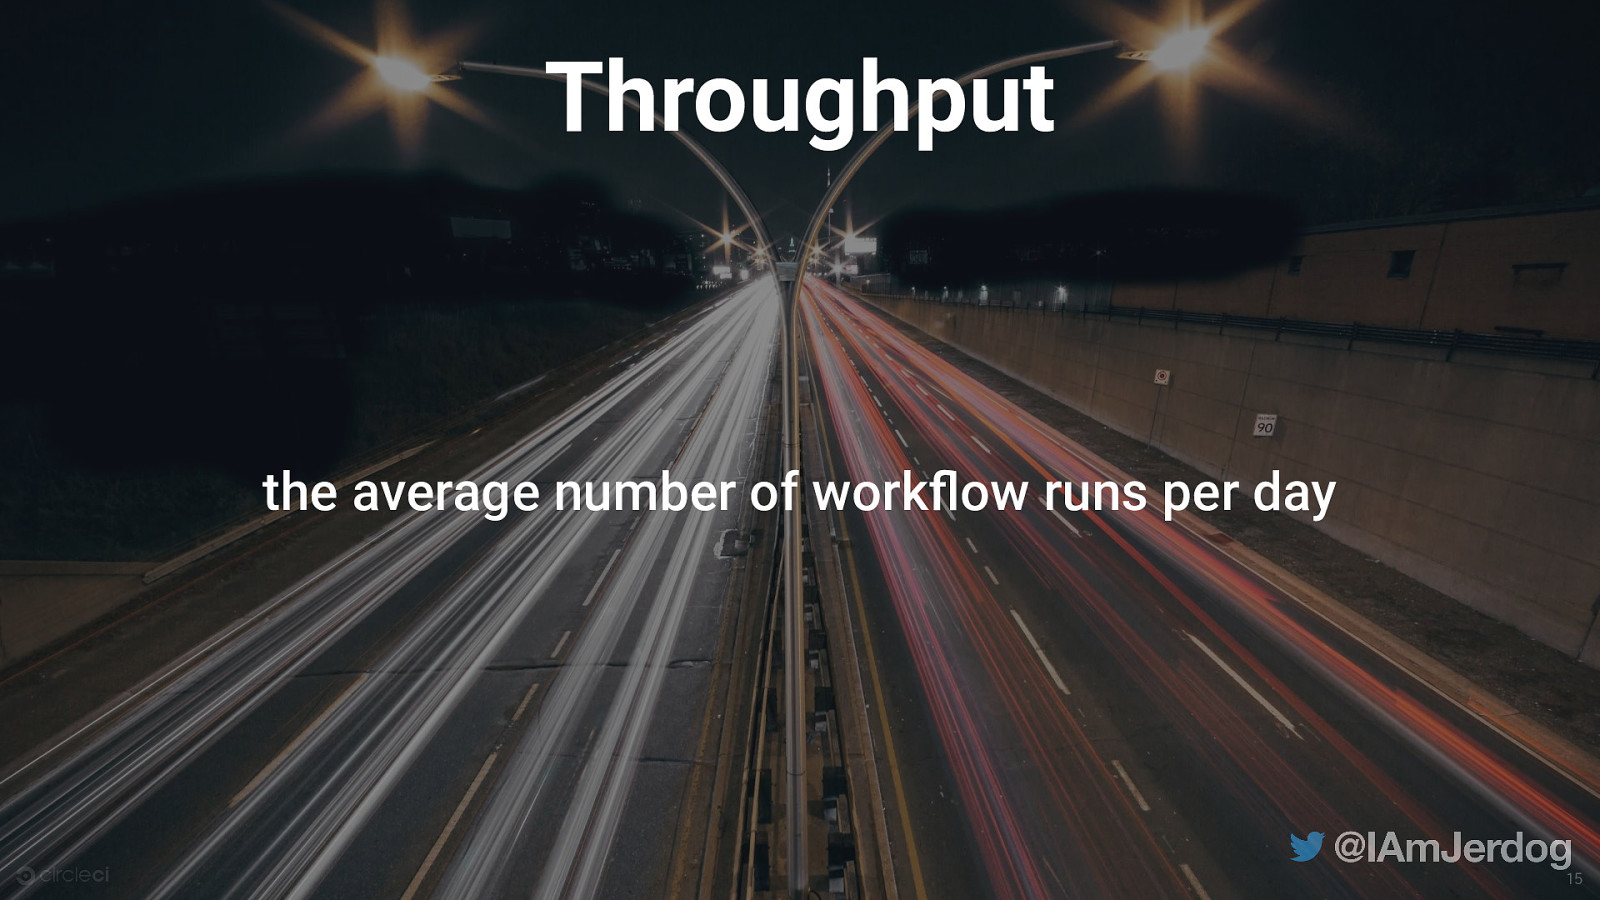
Throughput the average number of workflow runs per day 15
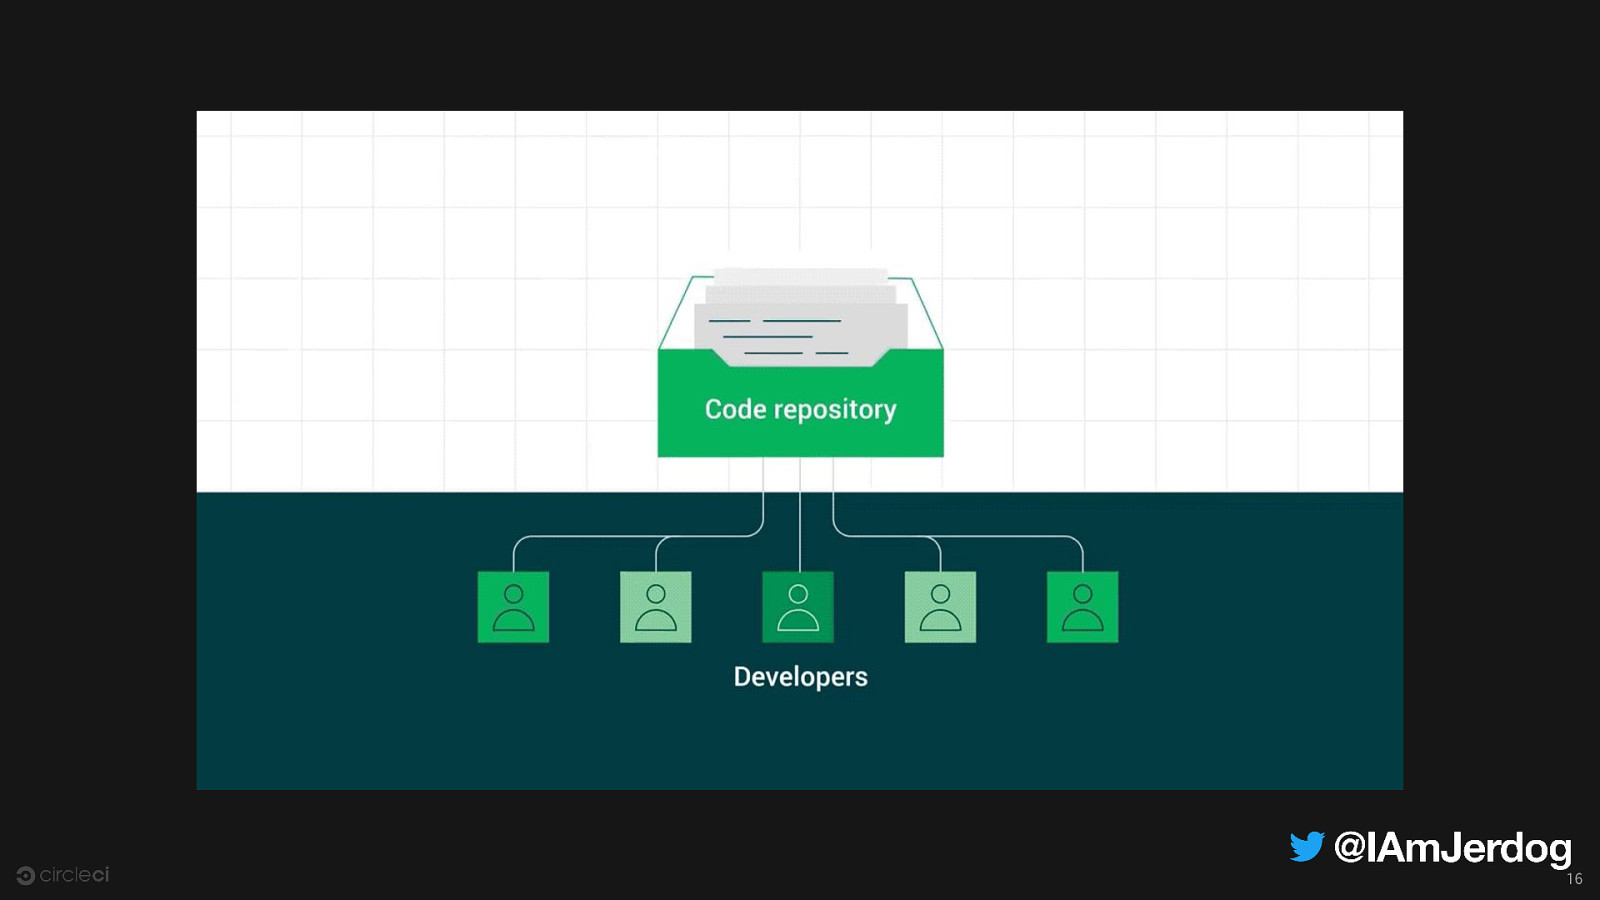
16
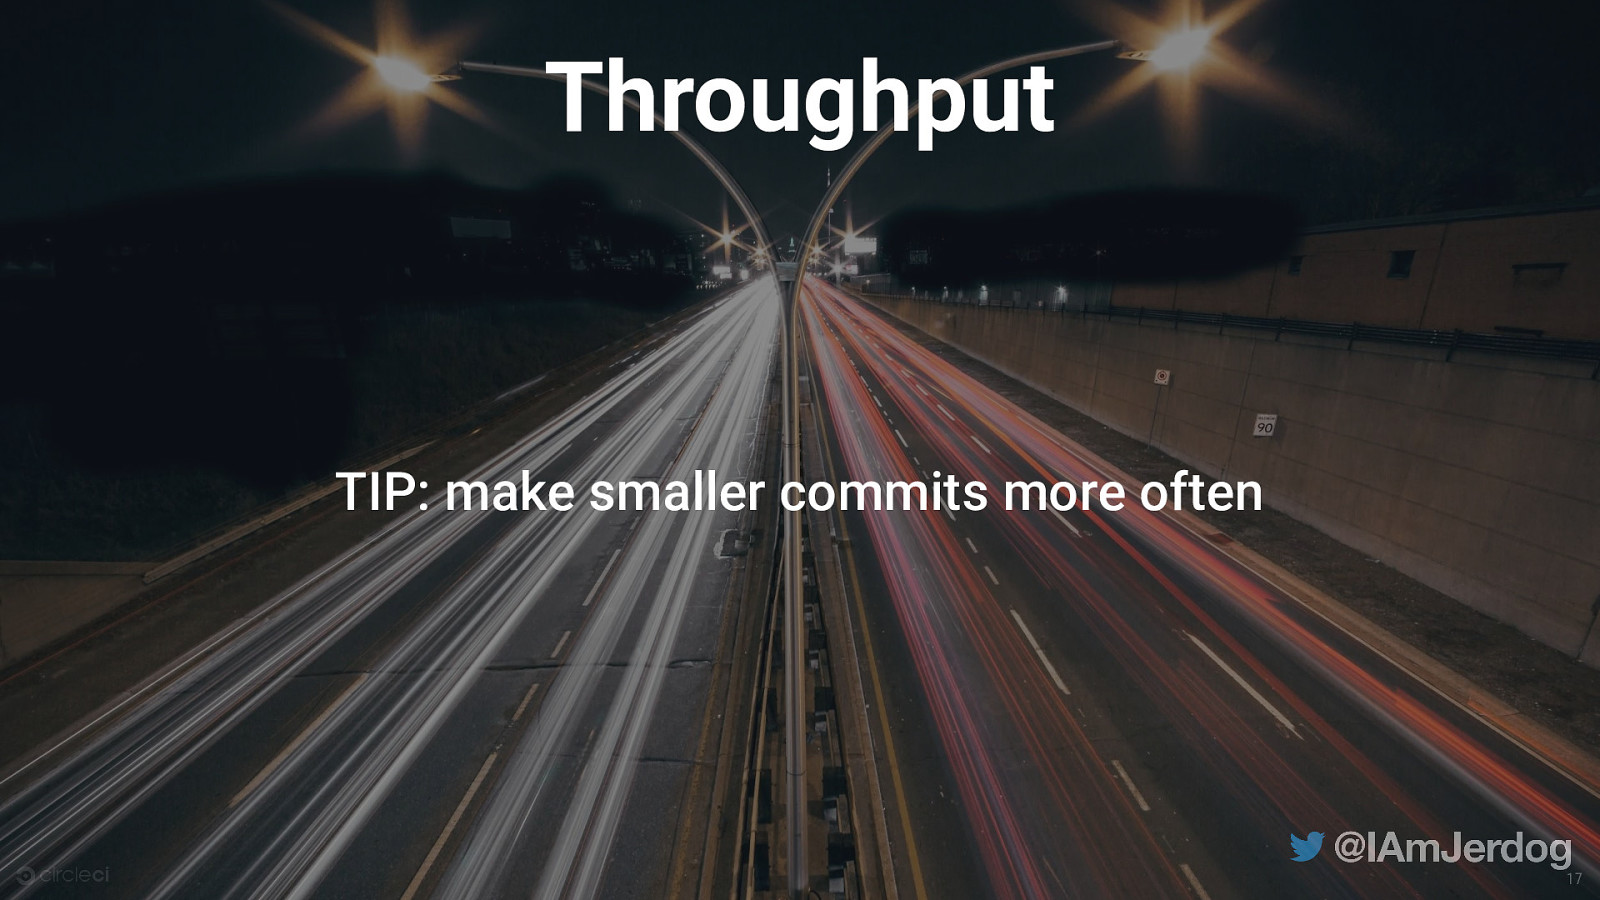
Throughput TIP: make smaller commits more often 17
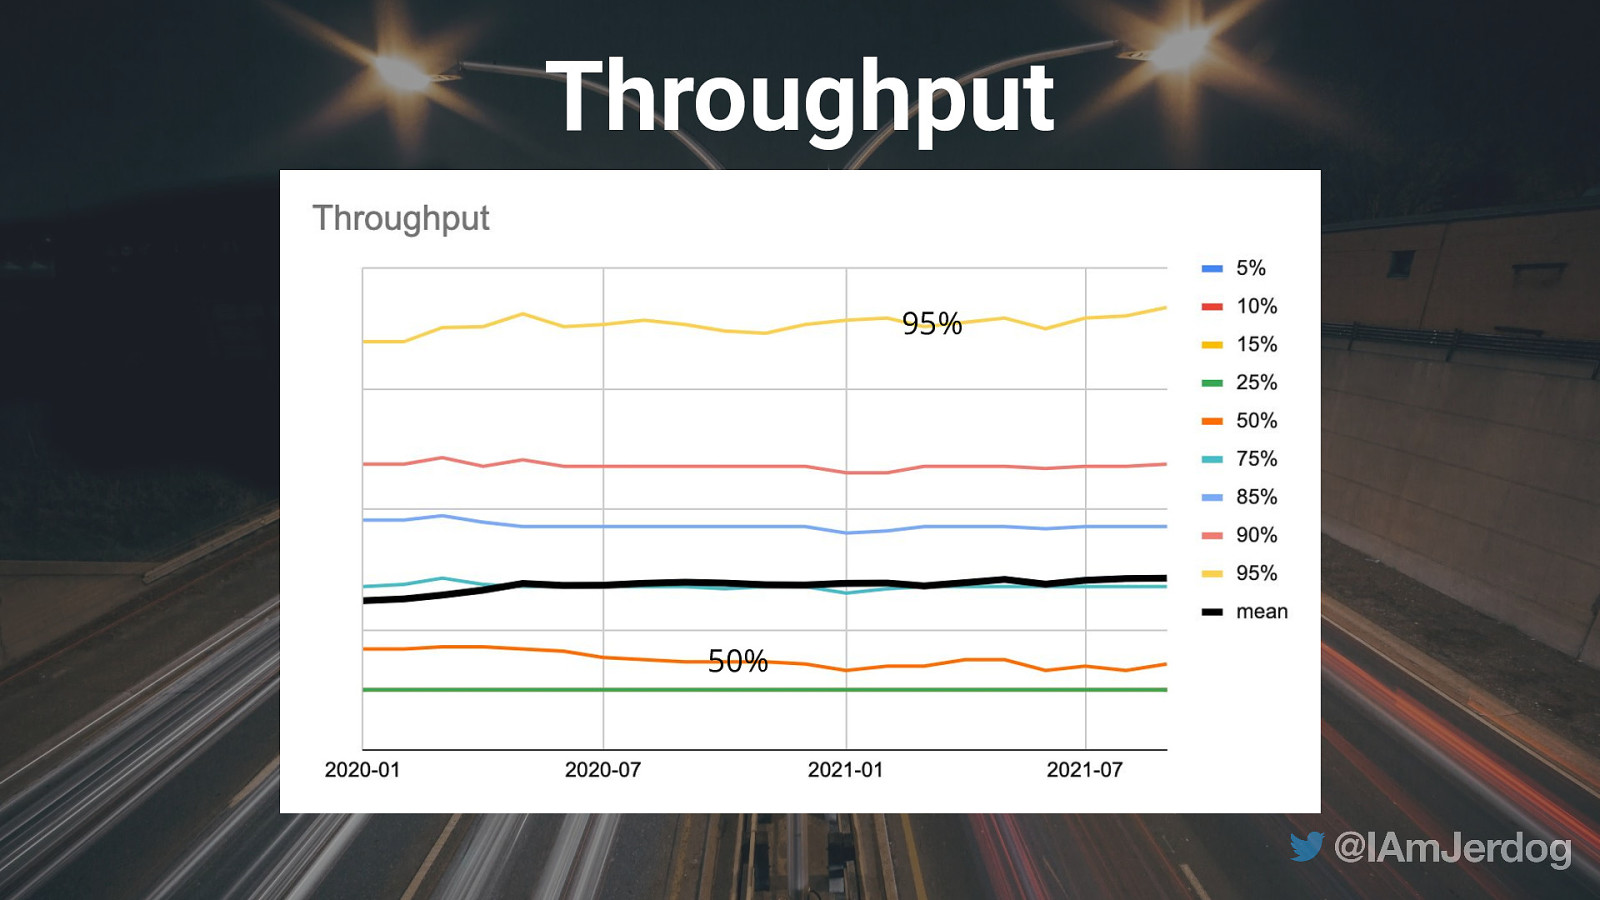
Throughput 95% 50% 50%

95% 50% Image credit: Giphy

Throughput April 2020 20
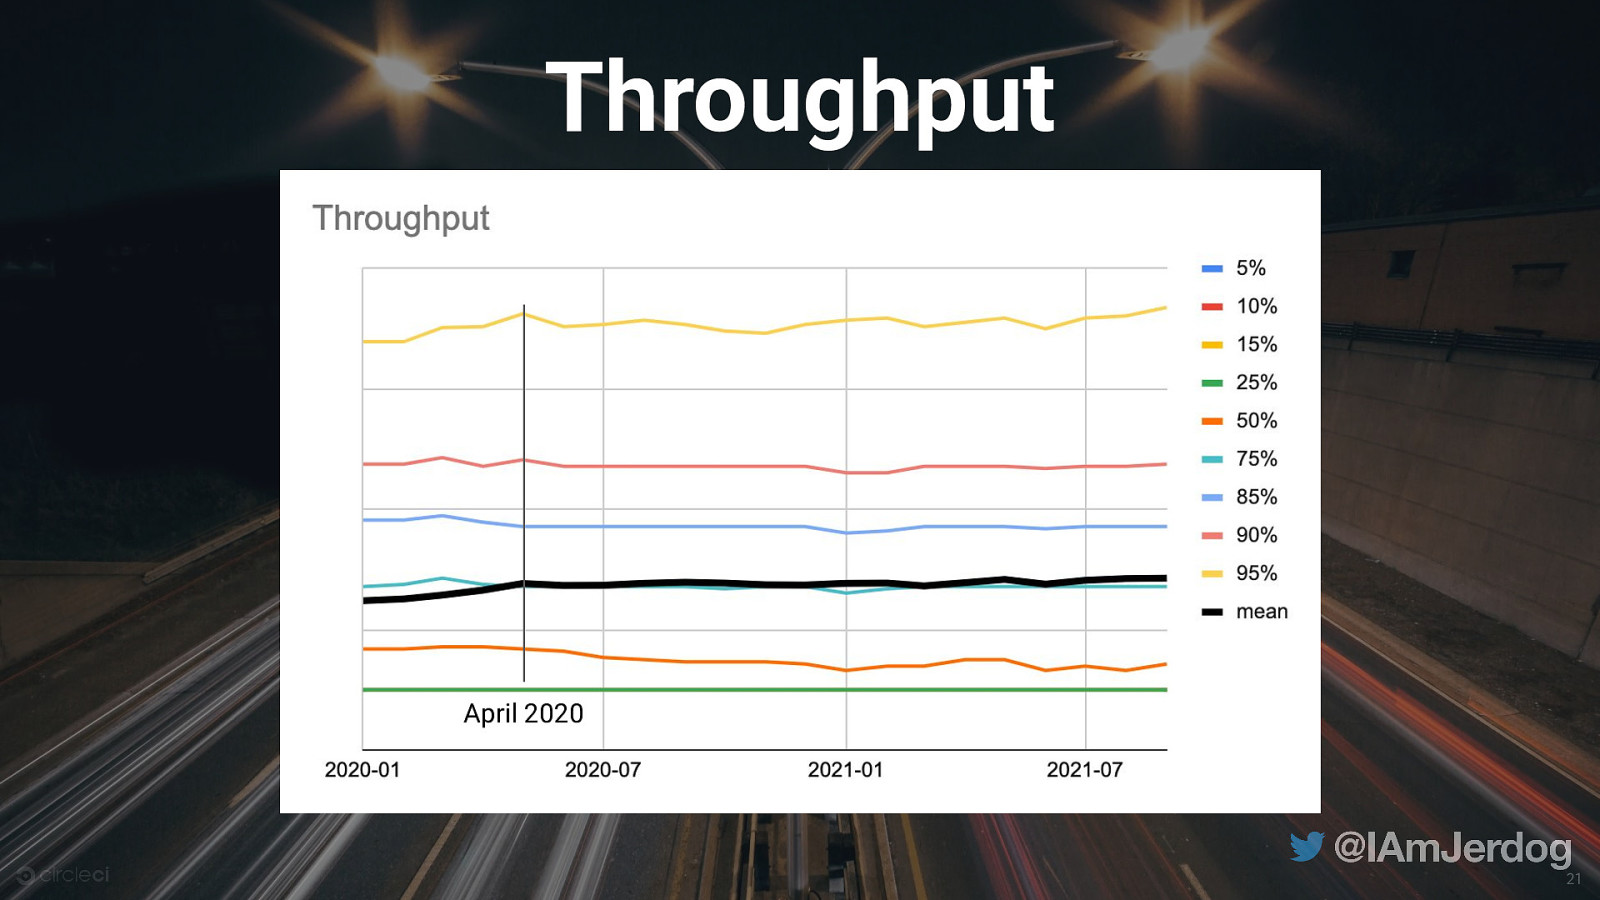
Throughput April 2020 21
Most teams are not deploying dozens of times per day
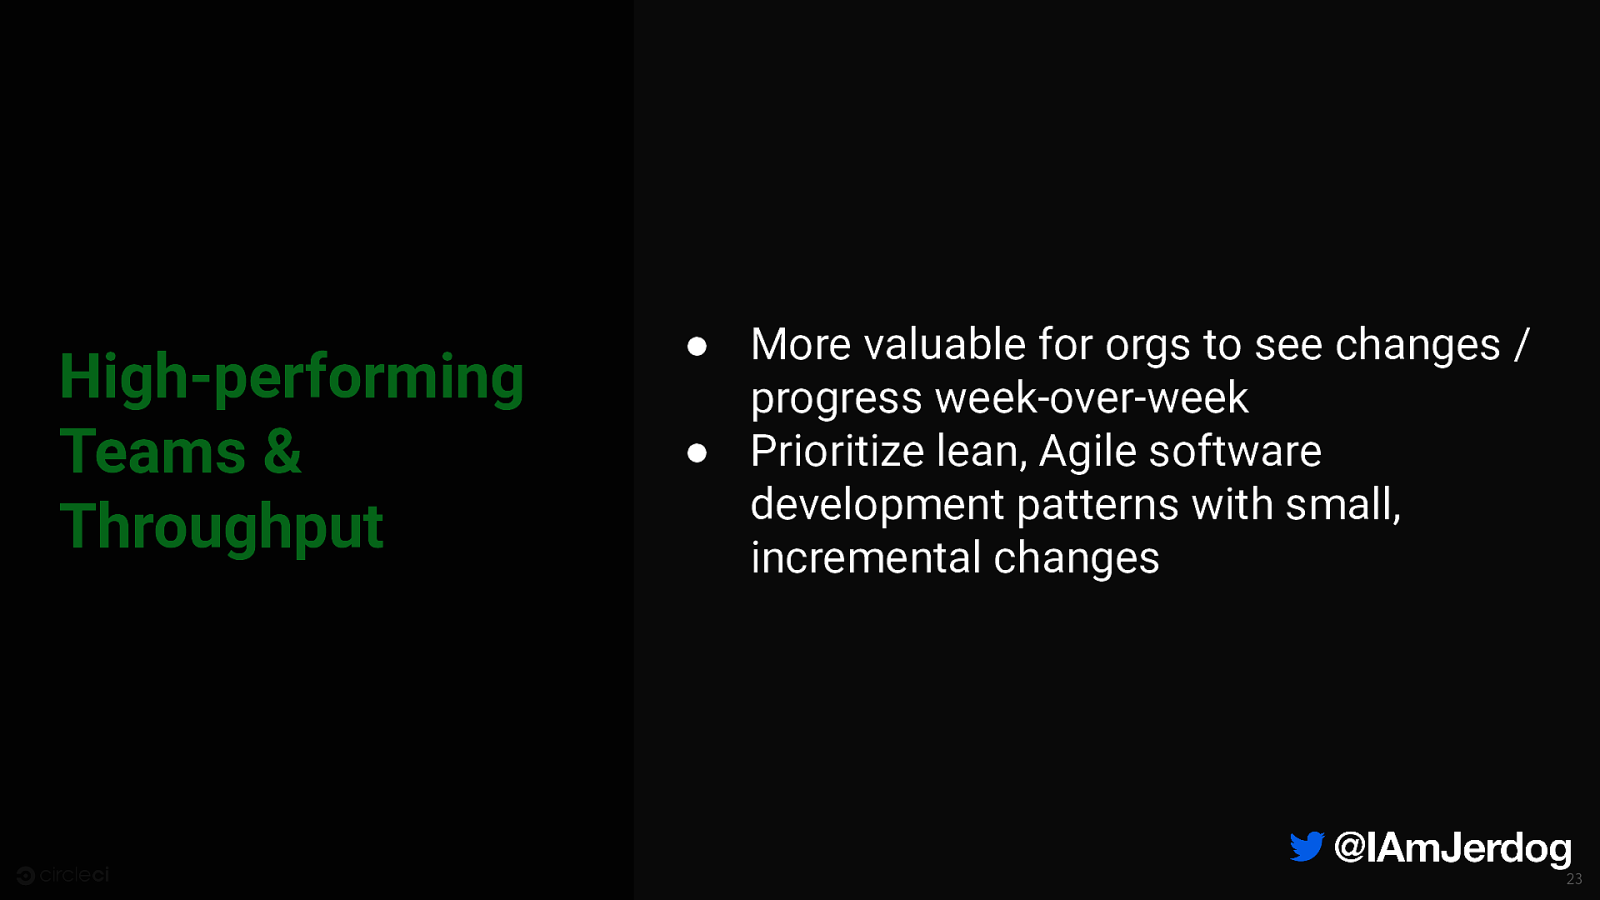
High-performing Teams & Throughput ● More valuable for orgs to see changes / progress week-over-week ● Prioritize lean, Agile software development patterns with small, incremental changes 23

Image by Pawan Kolhe from Pixabay

Duration Image by Pawan Kolhe from Pixabay the length of time it takes for a workflow to run 25

Image by Pawan Kolhe from Pixabay 26
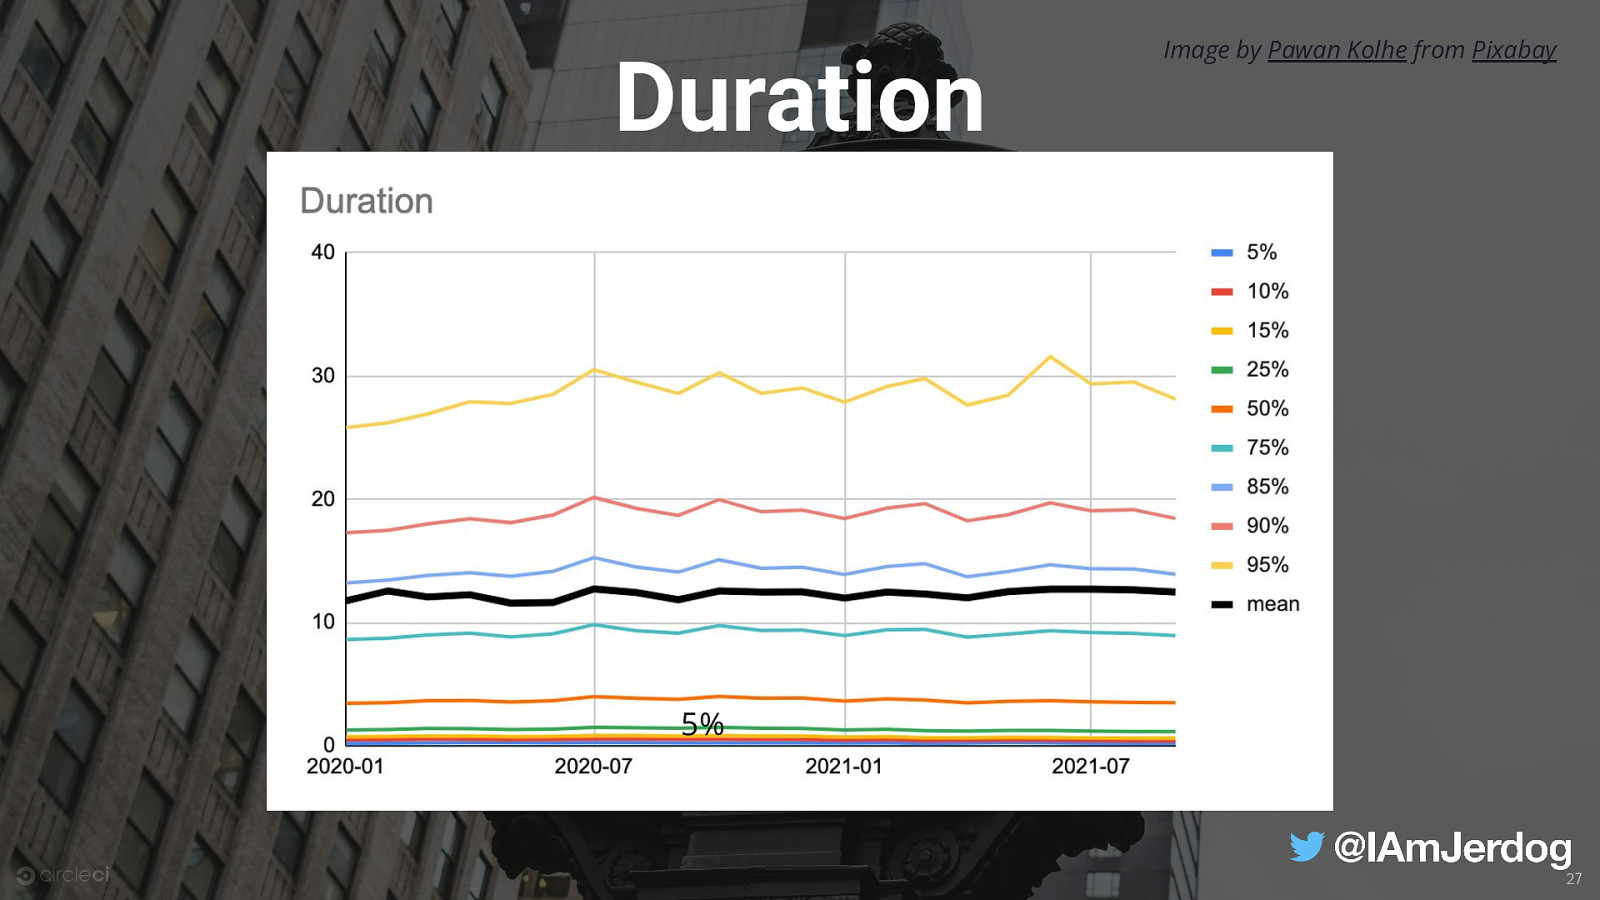
Duration Image by Pawan Kolhe from Pixabay 5% 27

Duration Image by Pawan Kolhe from Pixabay 28
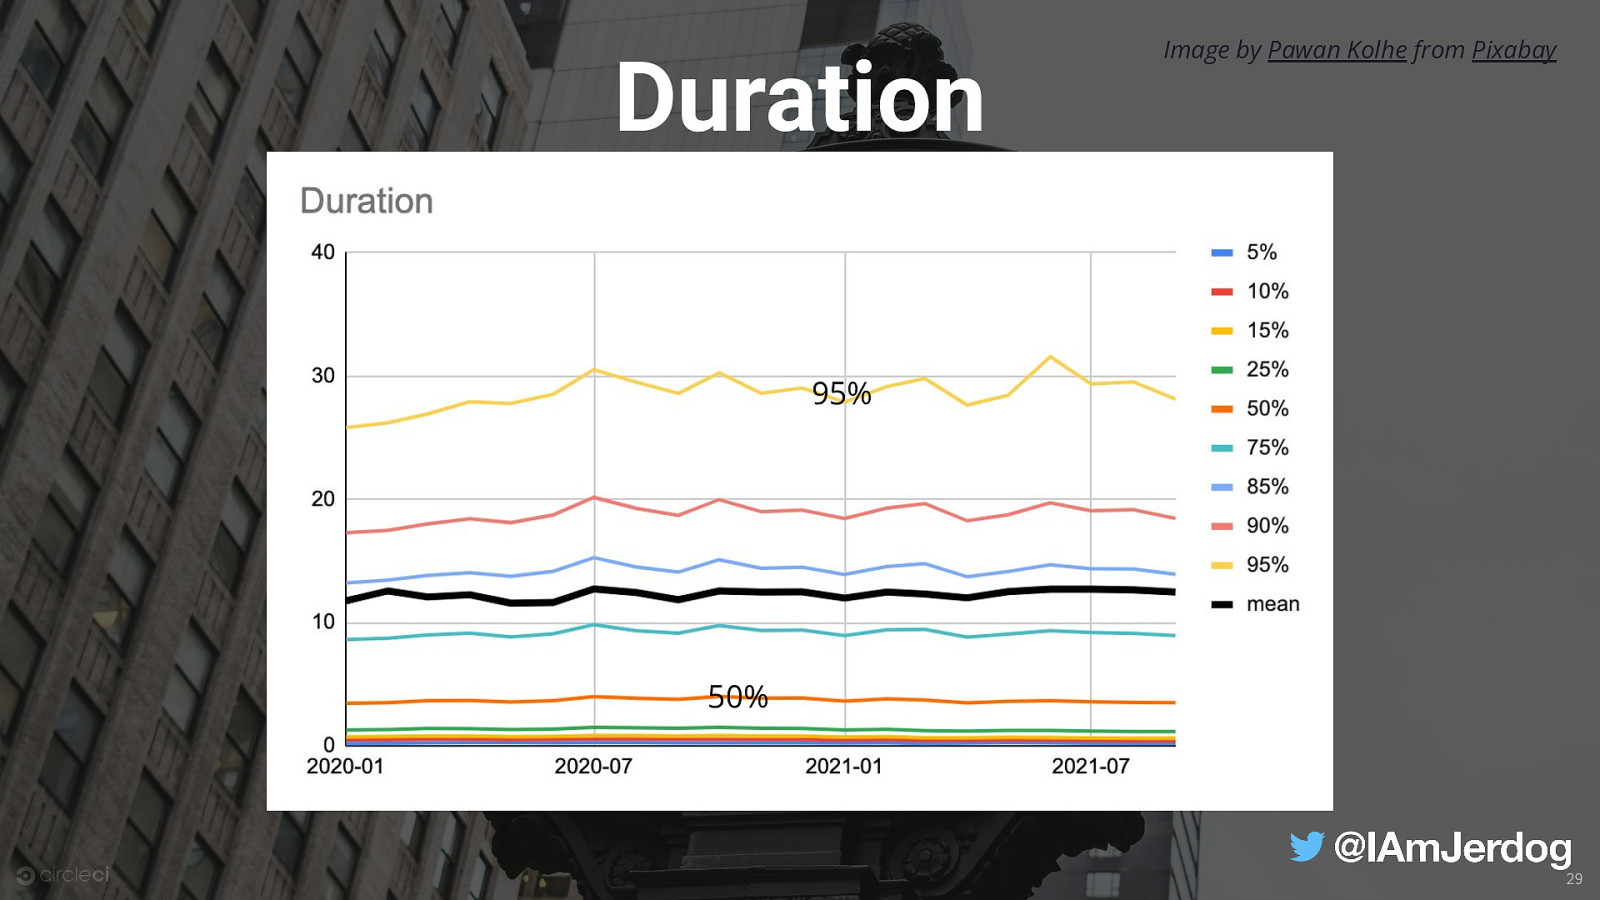
Duration Image by Pawan Kolhe from Pixabay 95% 50% 29
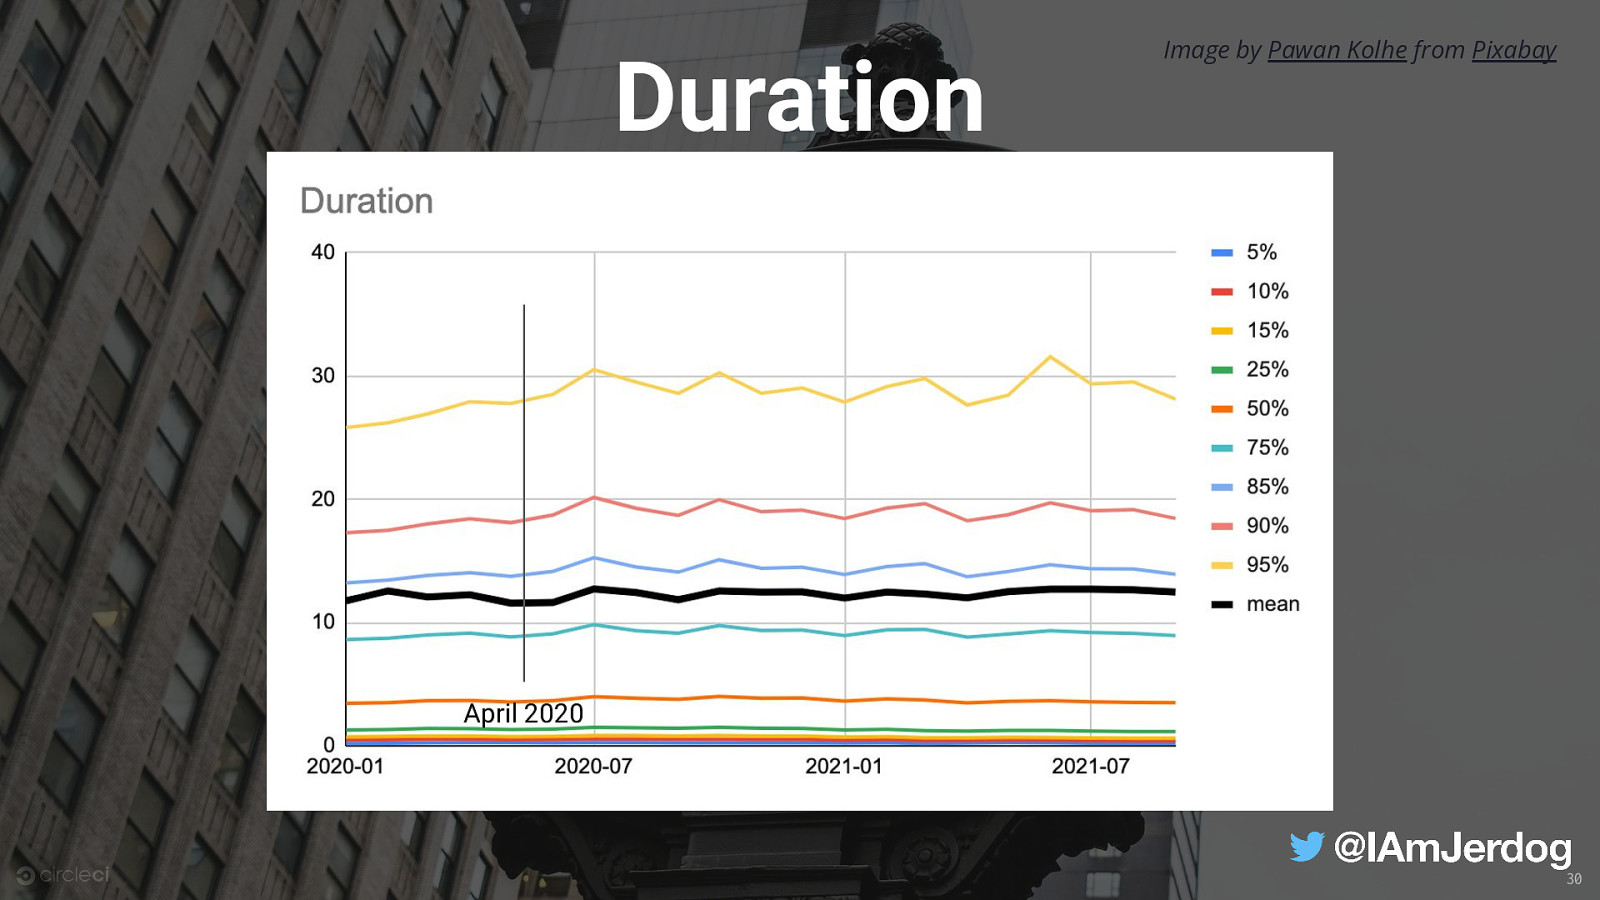
Duration Image by Pawan Kolhe from Pixabay April 2020 30
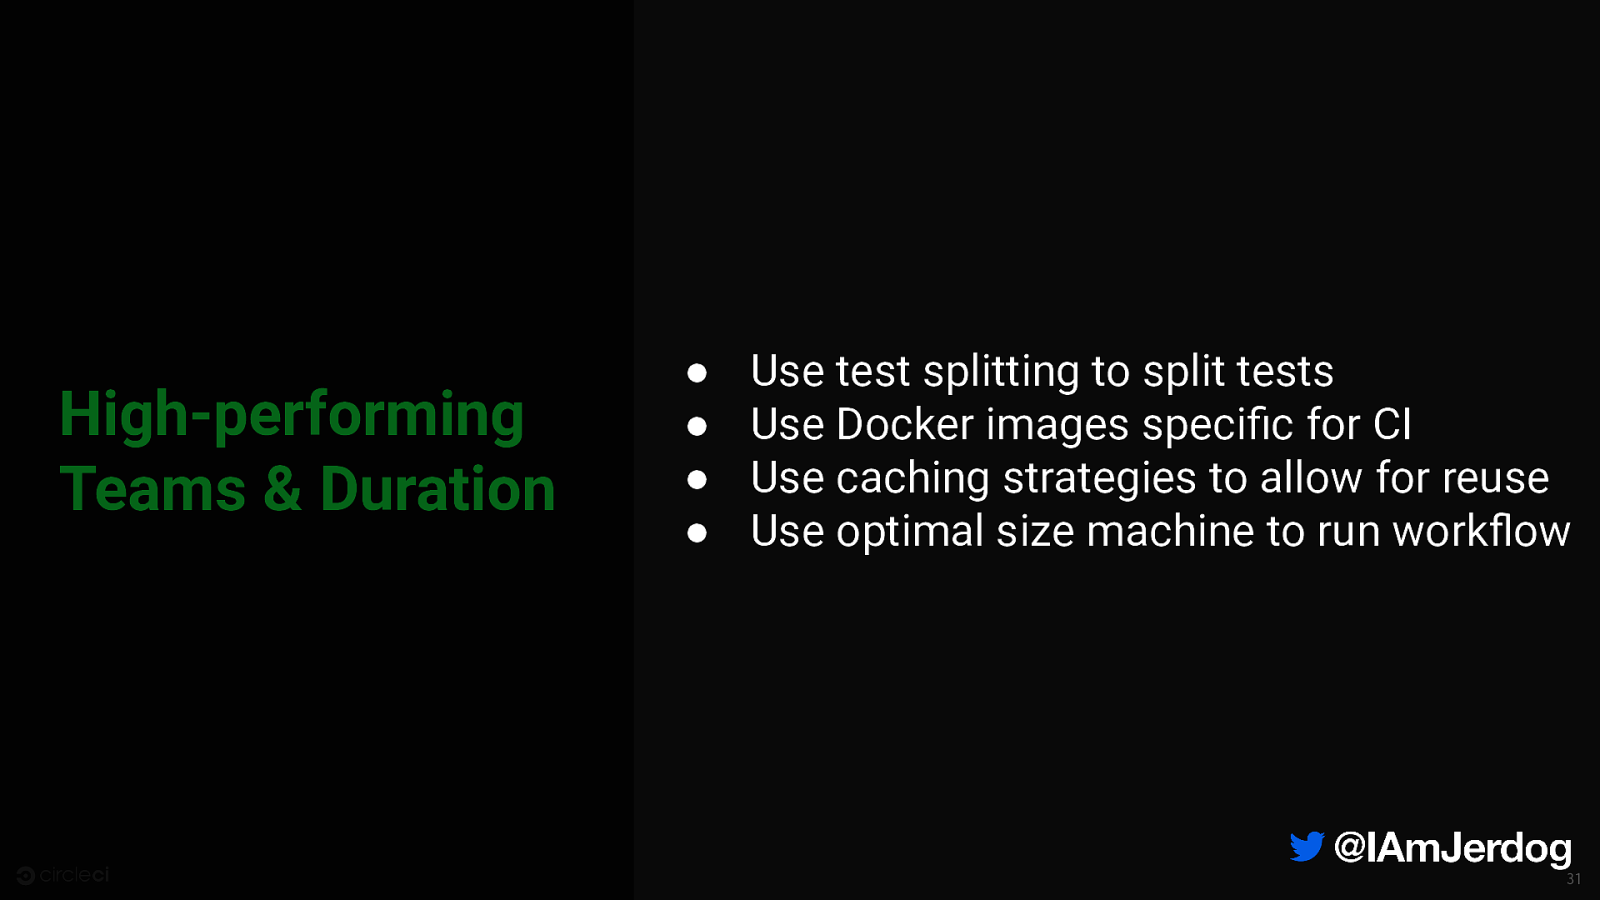
High-performing Teams & Duration ● ● ● ● Use test splitting to split tests Use Docker images specific for CI Use caching strategies to allow for reuse Use optimal size machine to run workflow 31

Photo by Brett Sayles from Pexels
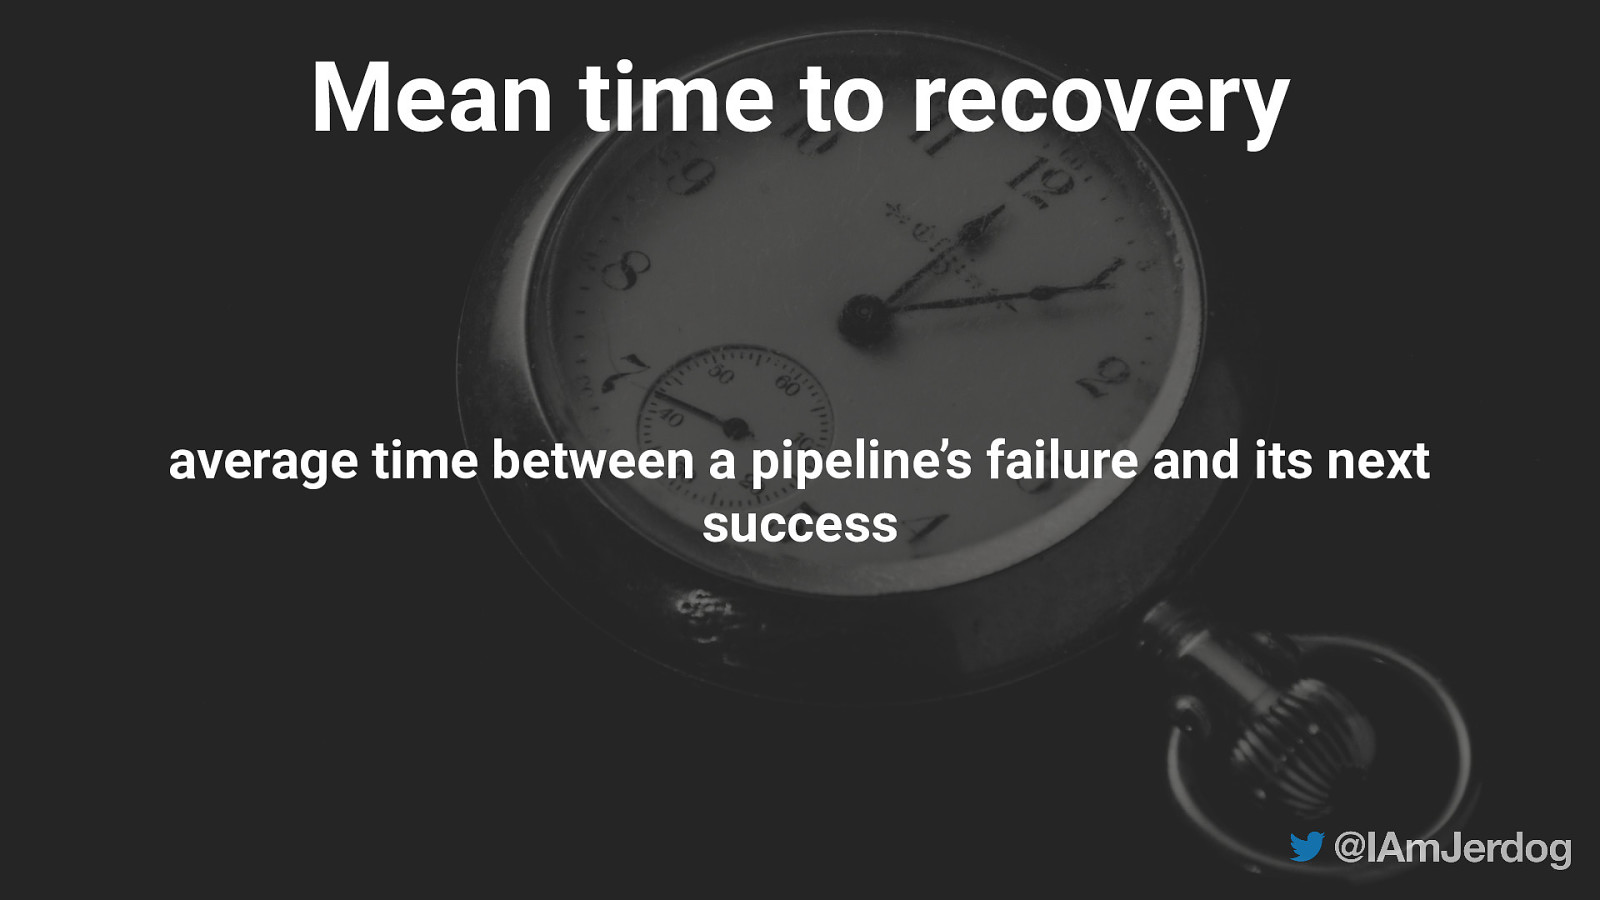
Mean time to recovery average time between a pipeline’s failure and its next success
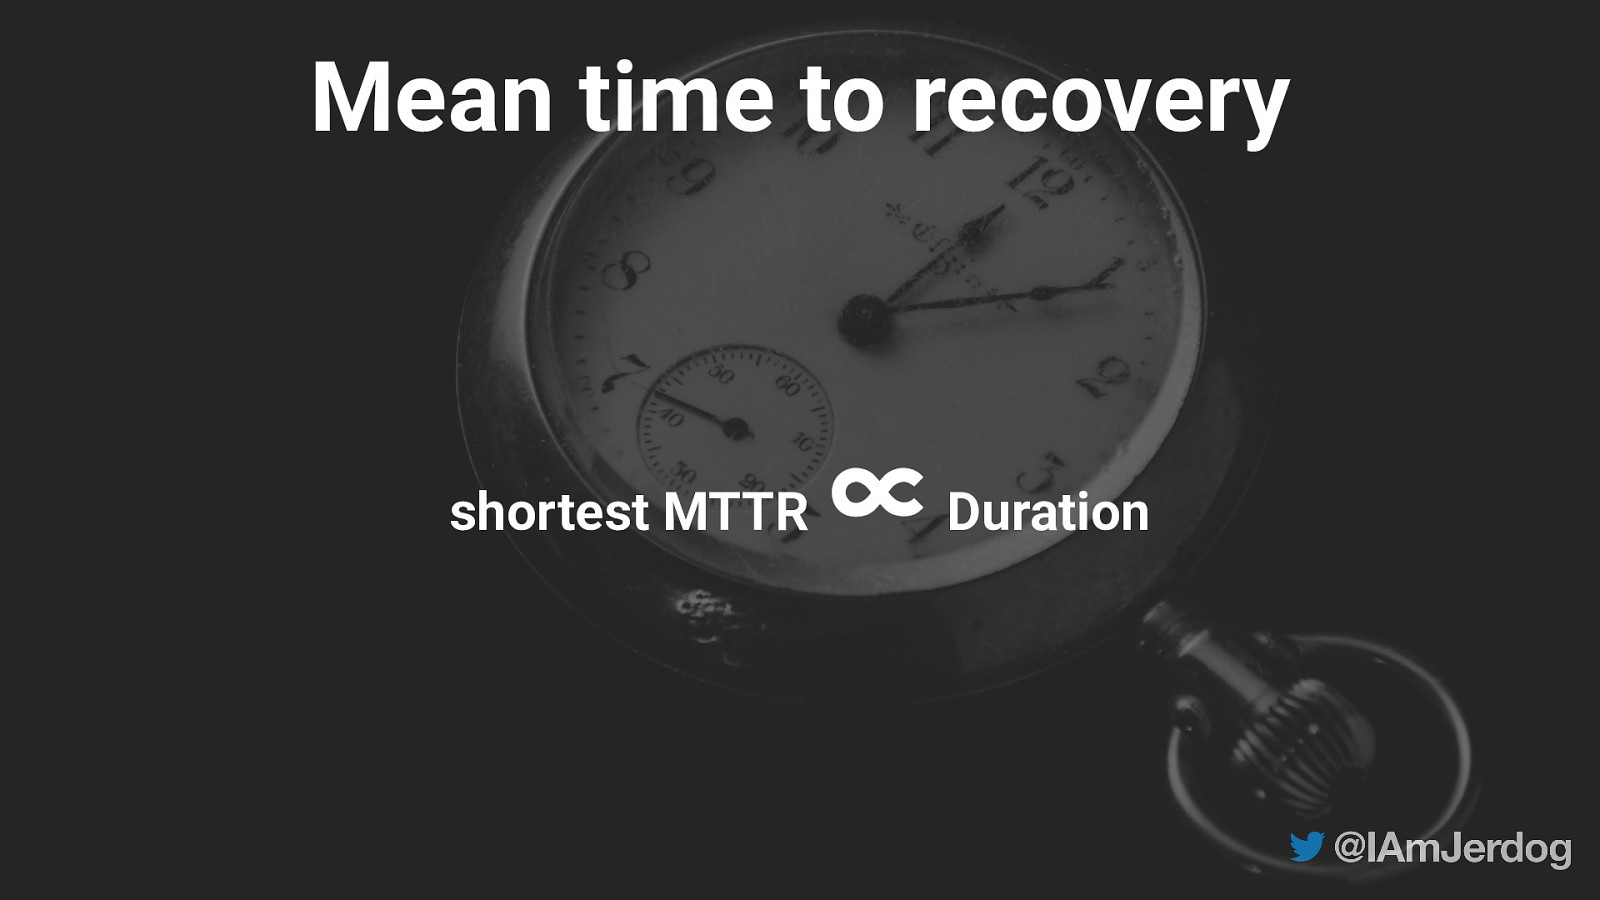
Mean time to recovery shortest MTTR ∝ Duration
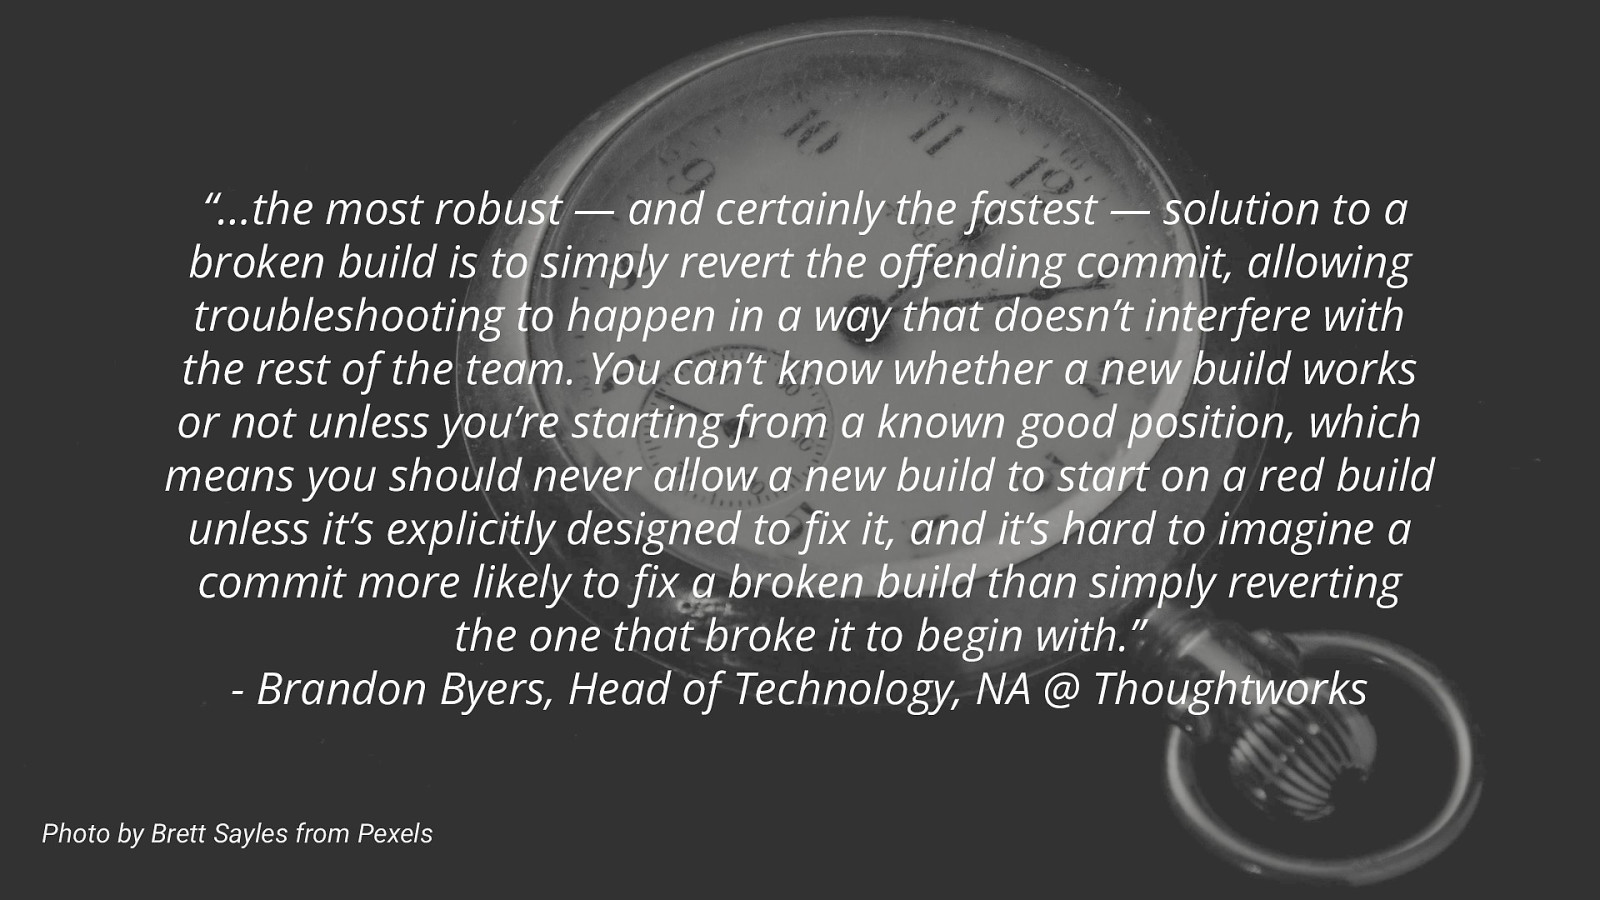
“…the most robust — and certainly the fastest — solution to a broken build is to simply revert the offending commit, allowing troubleshooting to happen in a way that doesn’t interfere with the rest of the team. You can’t know whether a new build works or not unless you’re starting from a known good position, which means you should never allow a new build to start on a red build unless it’s explicitly designed to fix it, and it’s hard to imagine a commit more likely to fix a broken build than simply reverting the one that broke it to begin with.” - Brandon Byers, Head of Technology, NA @ Thoughtworks Photo by Brett Sayles from Pexels 36
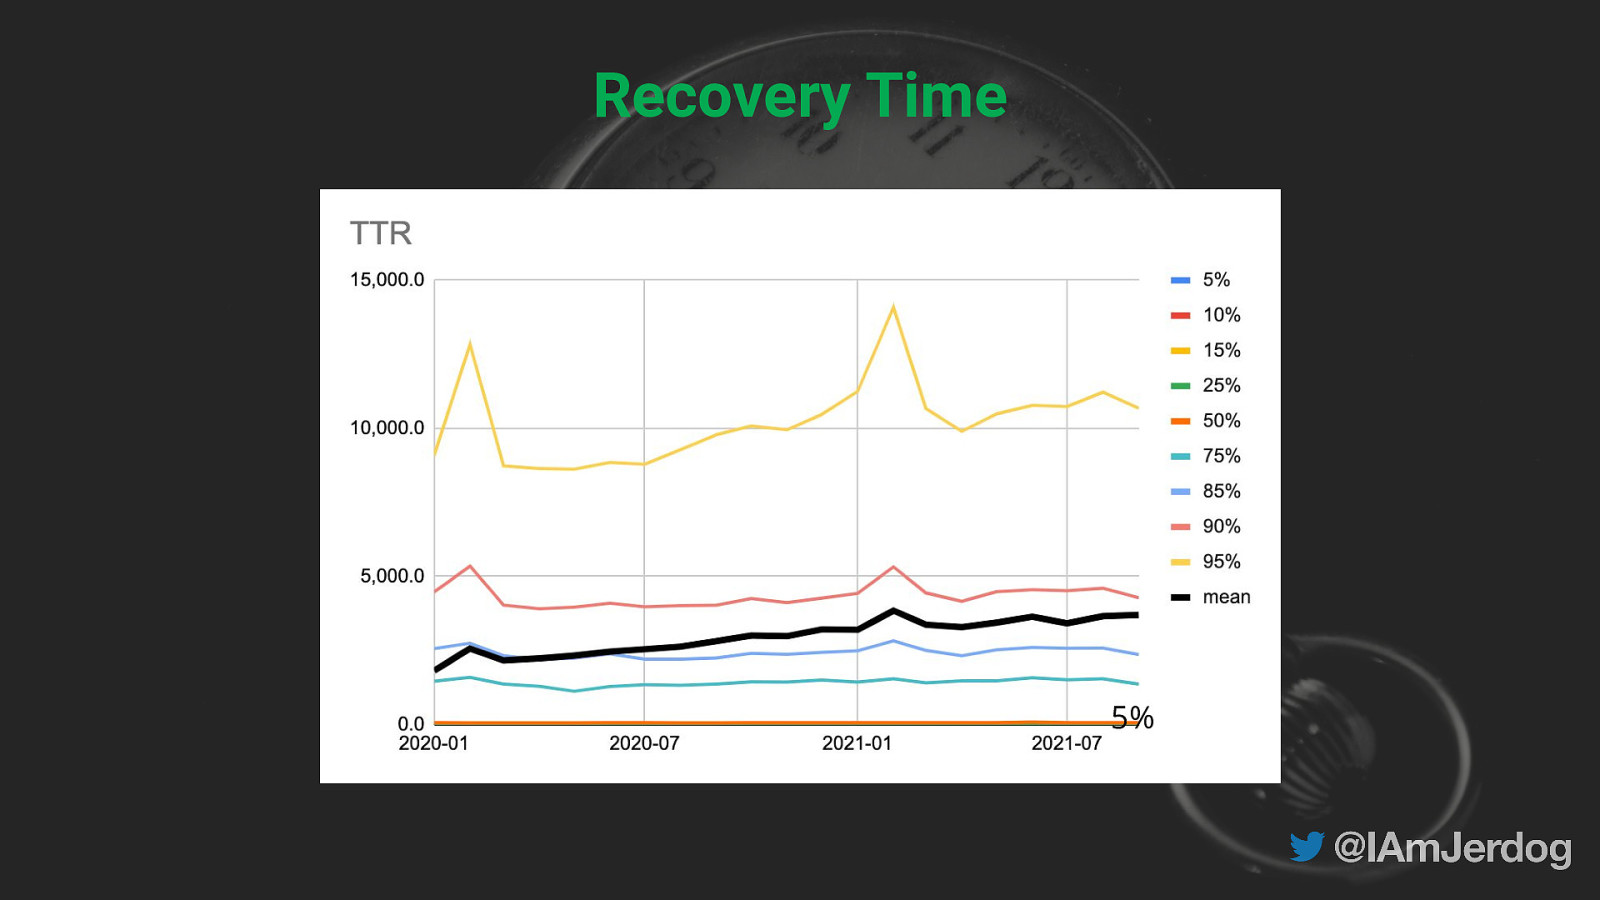
Recovery Time 5%
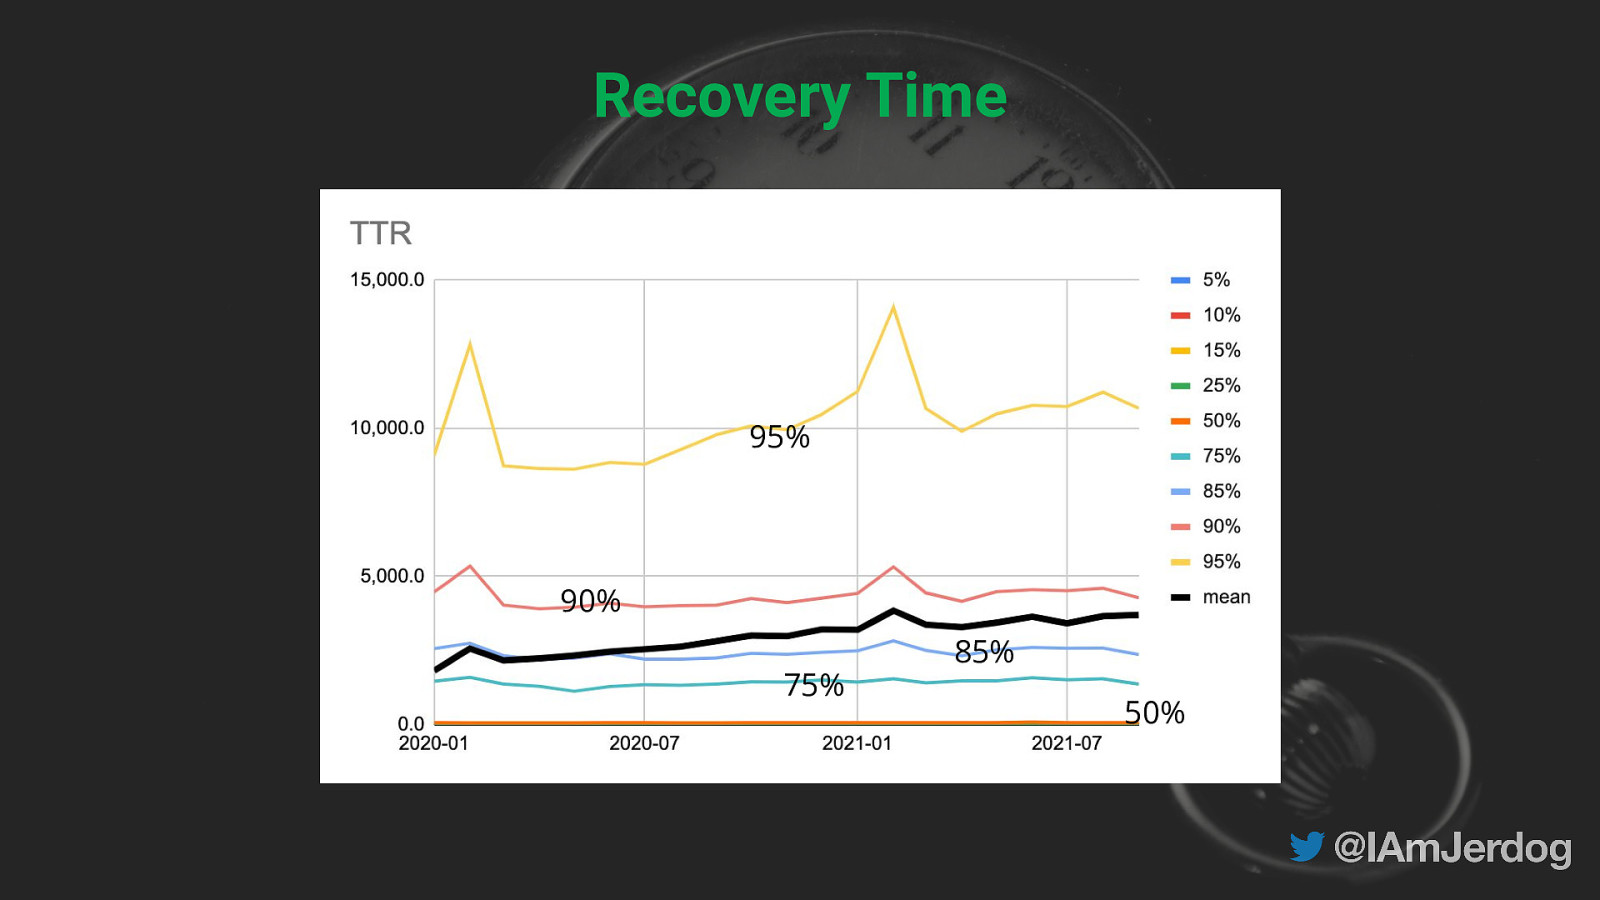
Recovery Time 95% 90% 75% 85% 50%
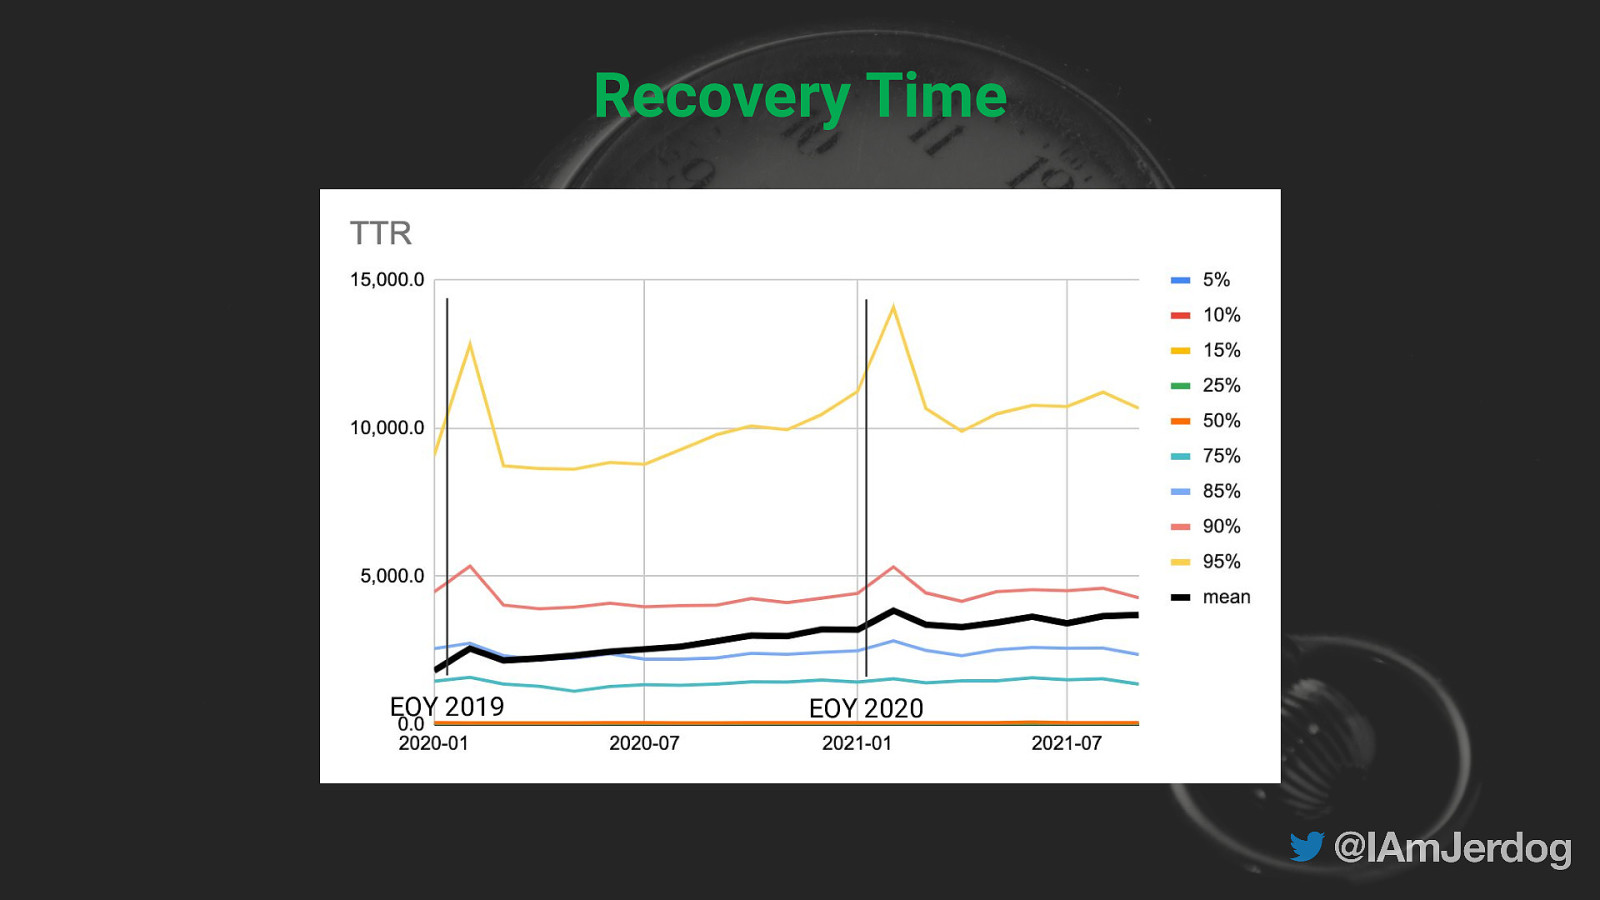
Recovery Time EOY 2019 EOY 2020
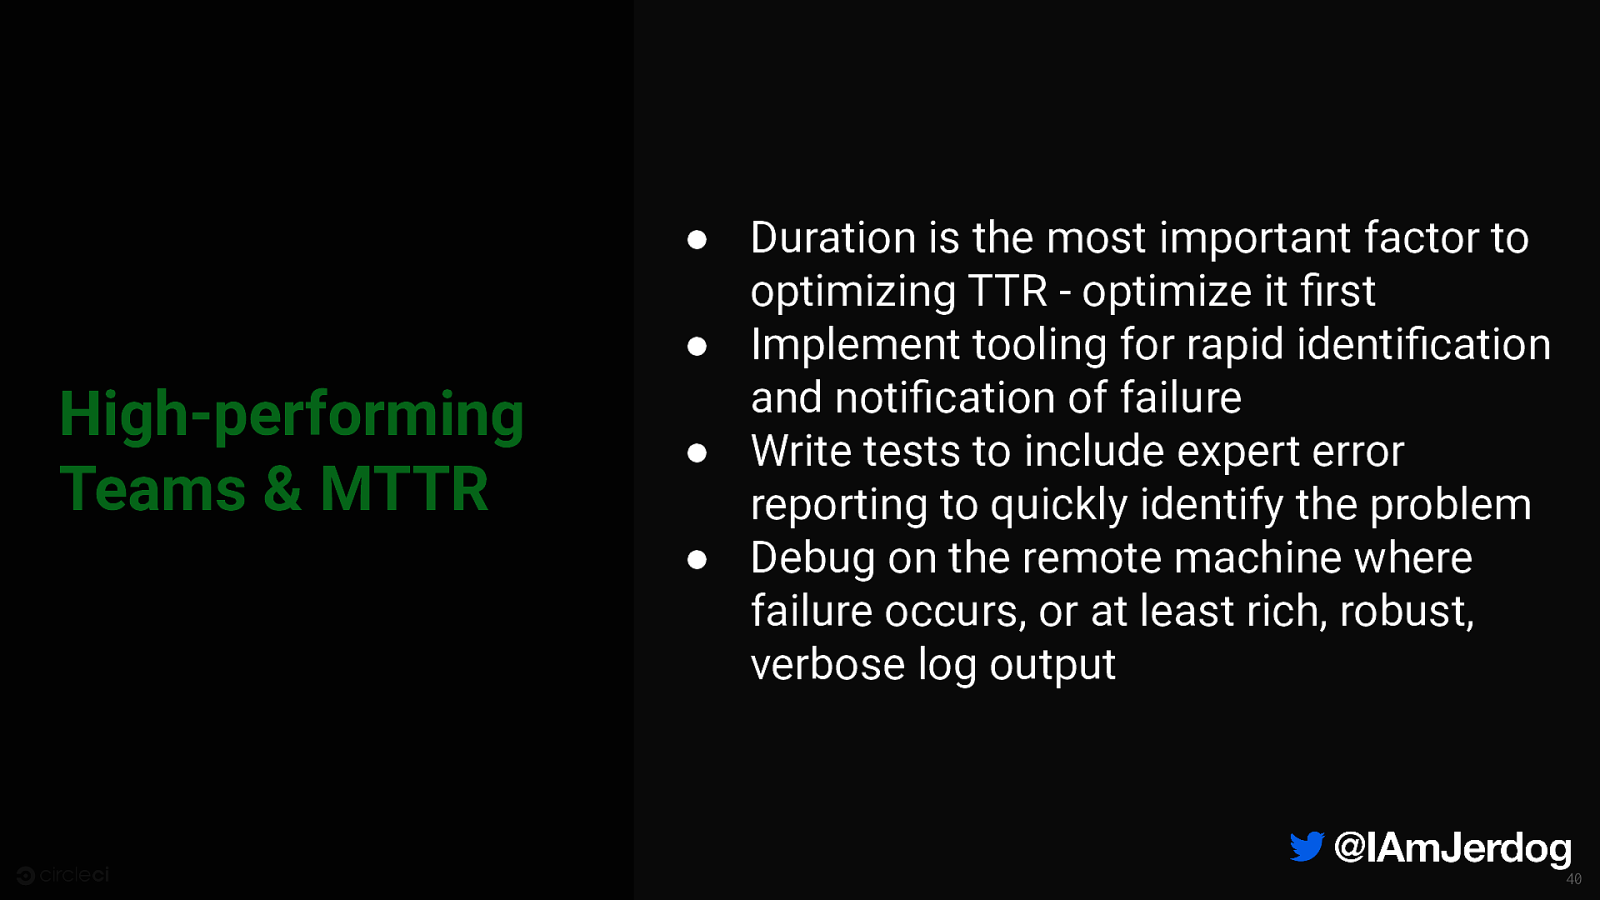
High-performing Teams & MTTR ● Duration is the most important factor to optimizing TTR - optimize it first ● Implement tooling for rapid identification and notification of failure ● Write tests to include expert error reporting to quickly identify the problem ● Debug on the remote machine where failure occurs, or at least rich, robust, verbose log output 40

Photo by Lukas from Pexels
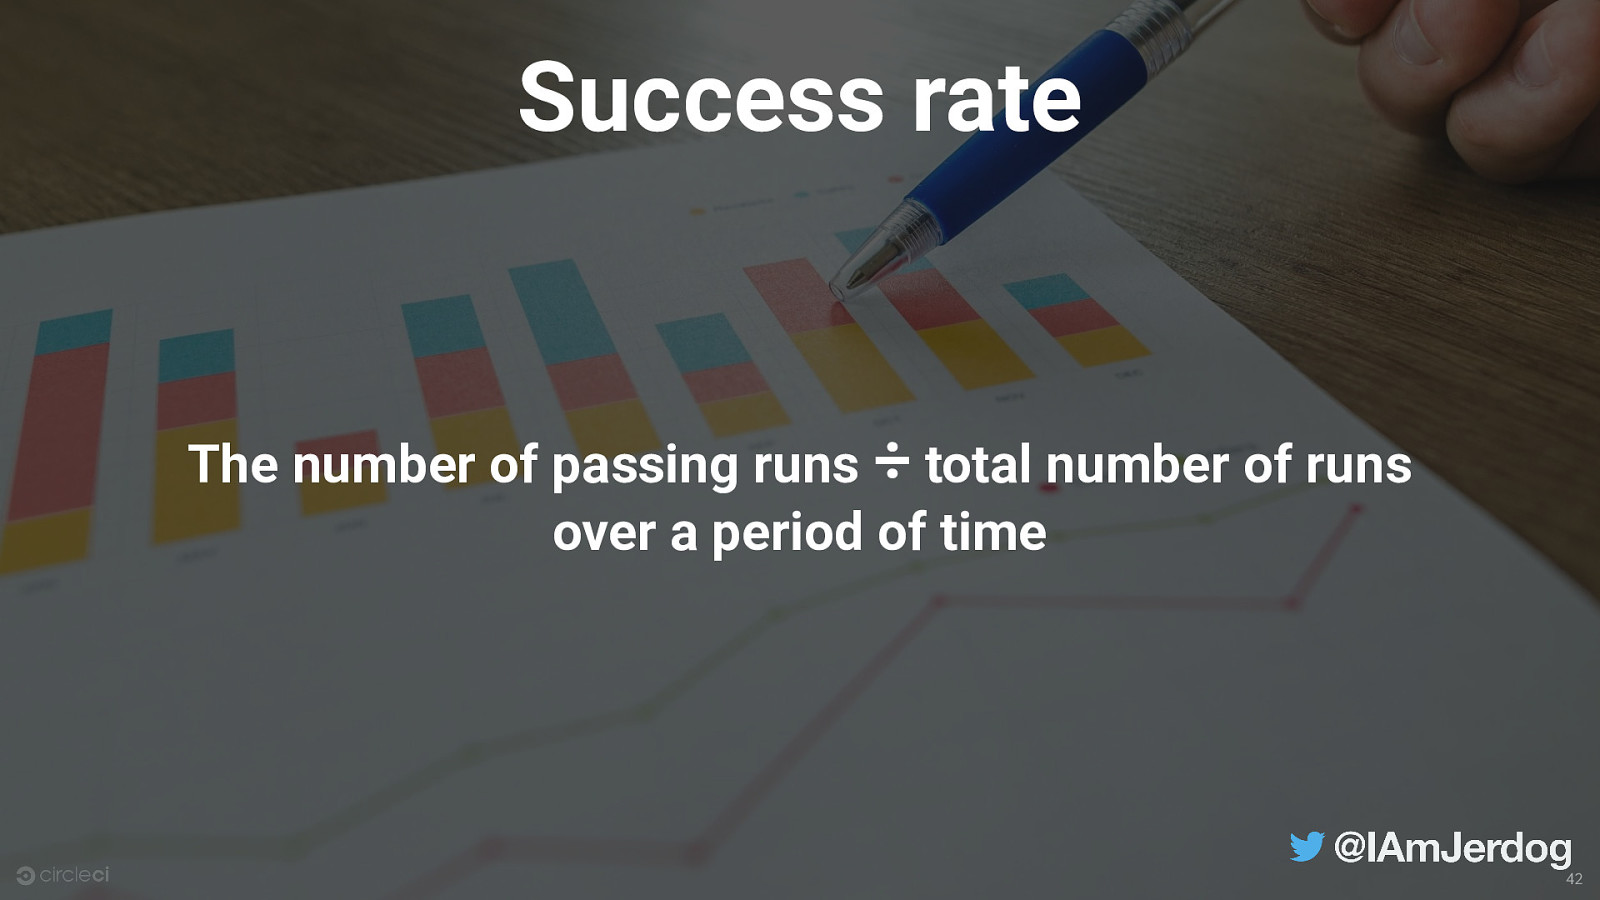
Success rate The number of passing runs ÷ total number of runs over a period of time 42

43

Success rate April 2020 44
Success rate April 2020 45
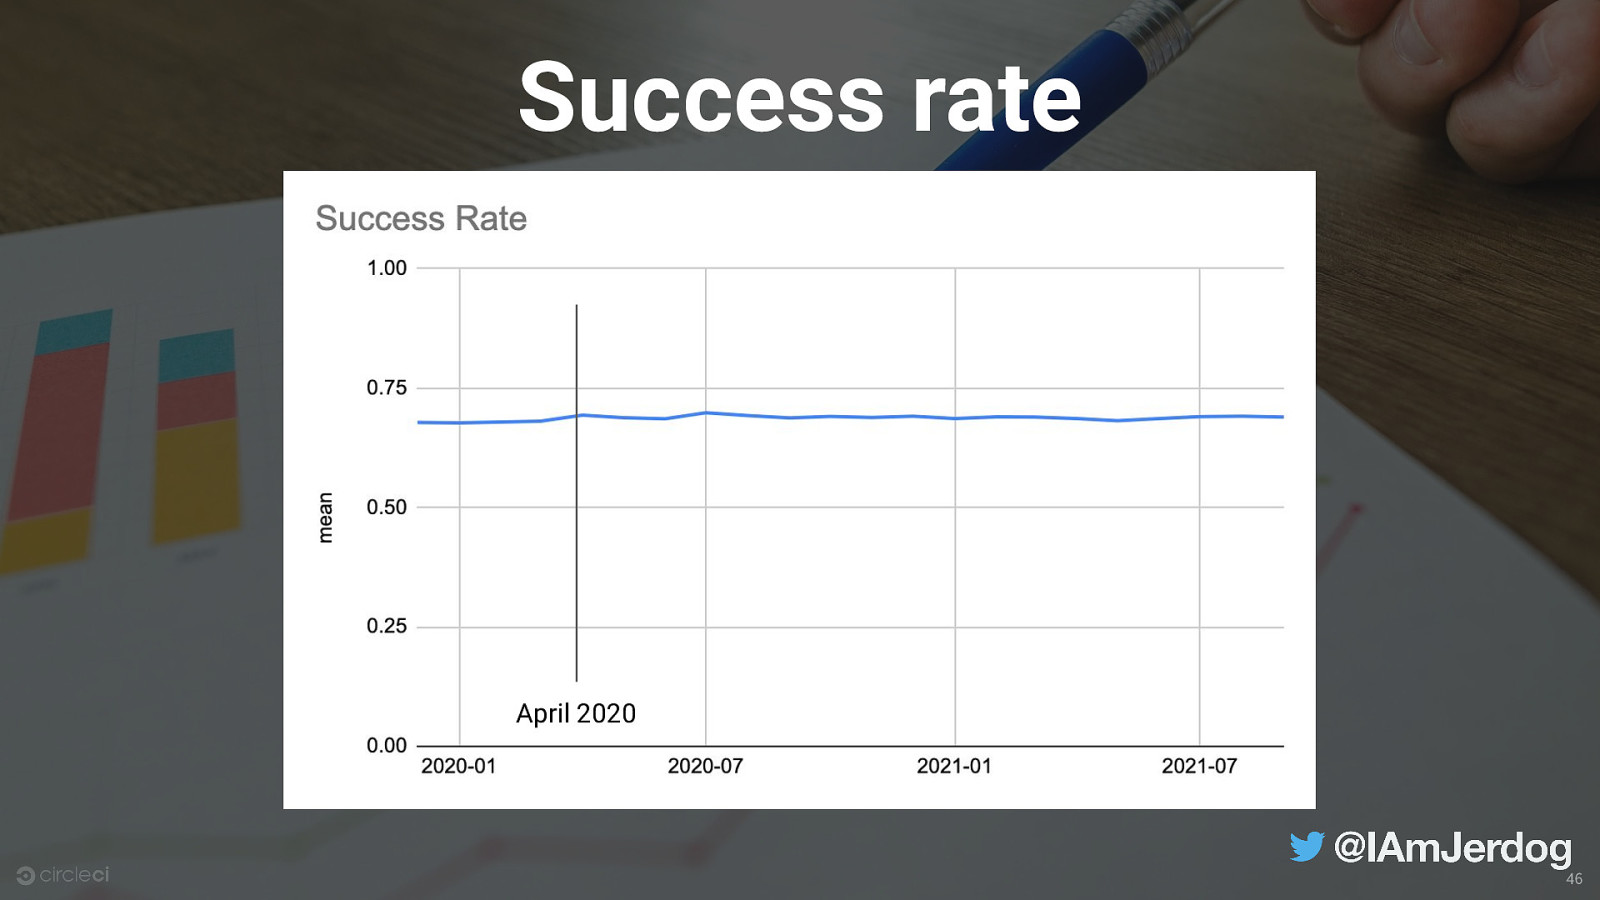
Success rate April 2020 46
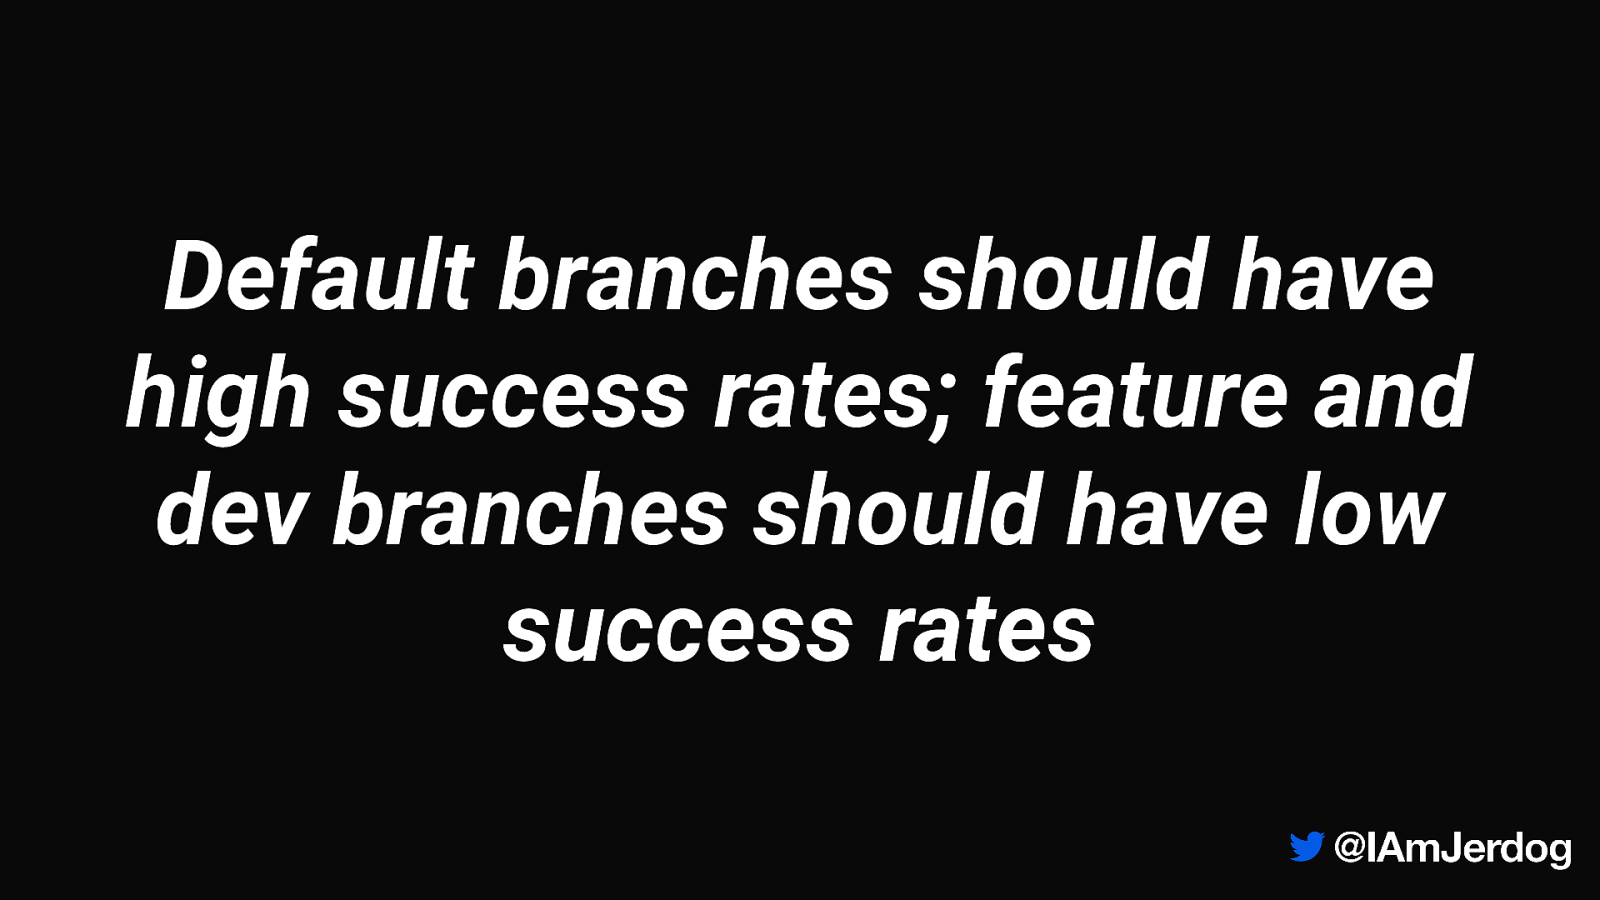
Default branches should have high success rates; feature and dev branches should have low success rates
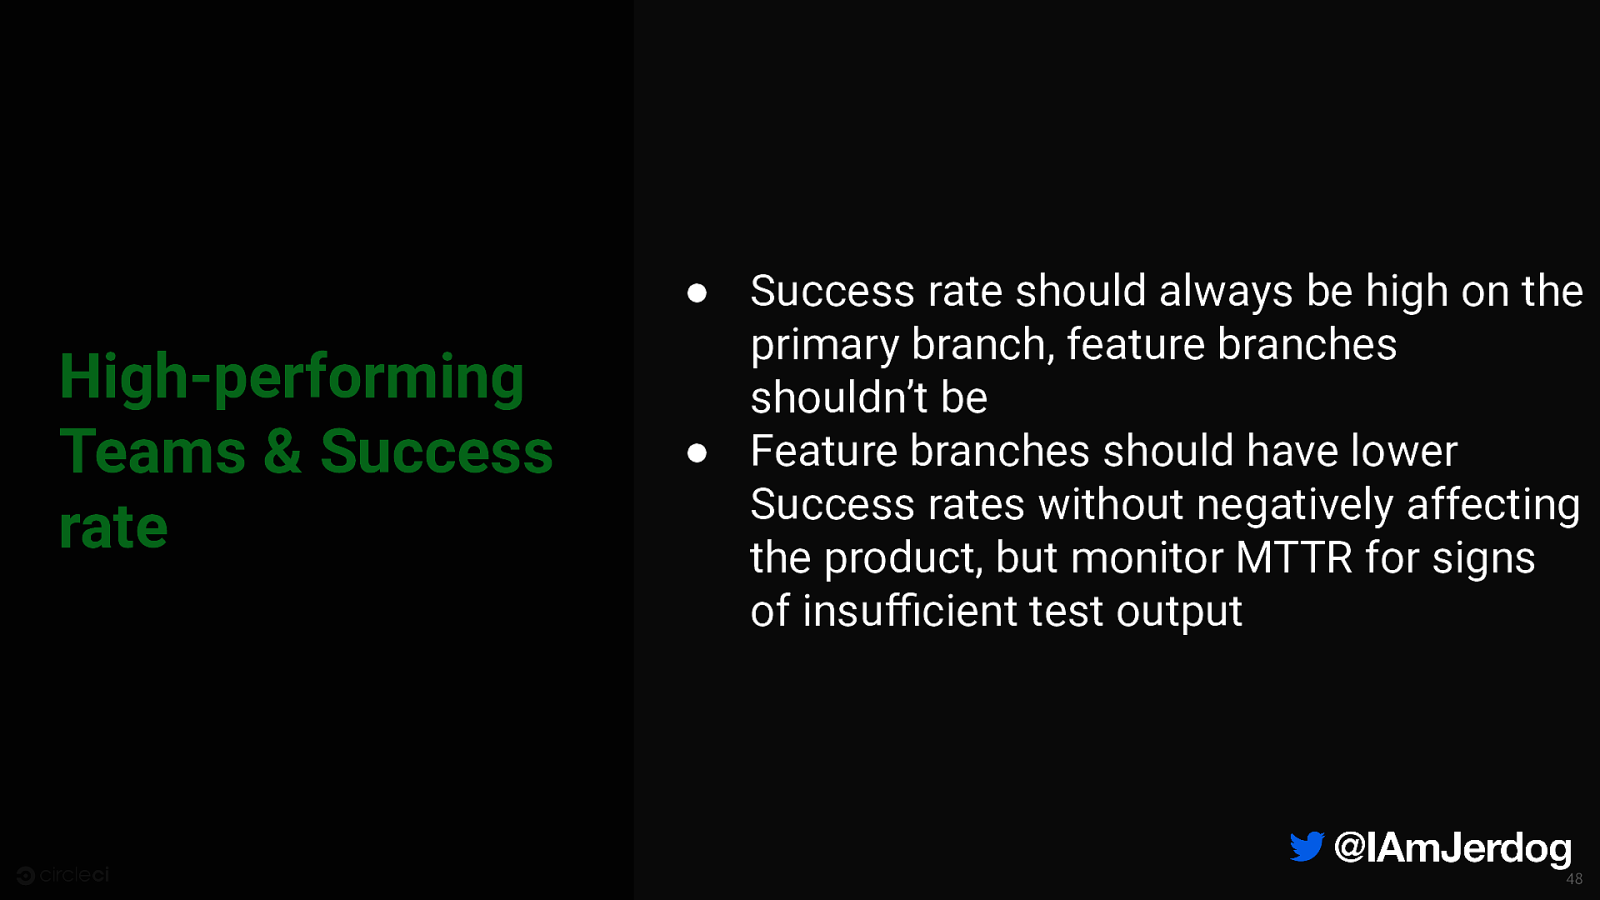
High-performing Teams & Success rate ● Success rate should always be high on the primary branch, feature branches shouldn’t be ● Feature branches should have lower Success rates without negatively affecting the product, but monitor MTTR for signs of insufficient test output 48

So what should a high-performing team look like?
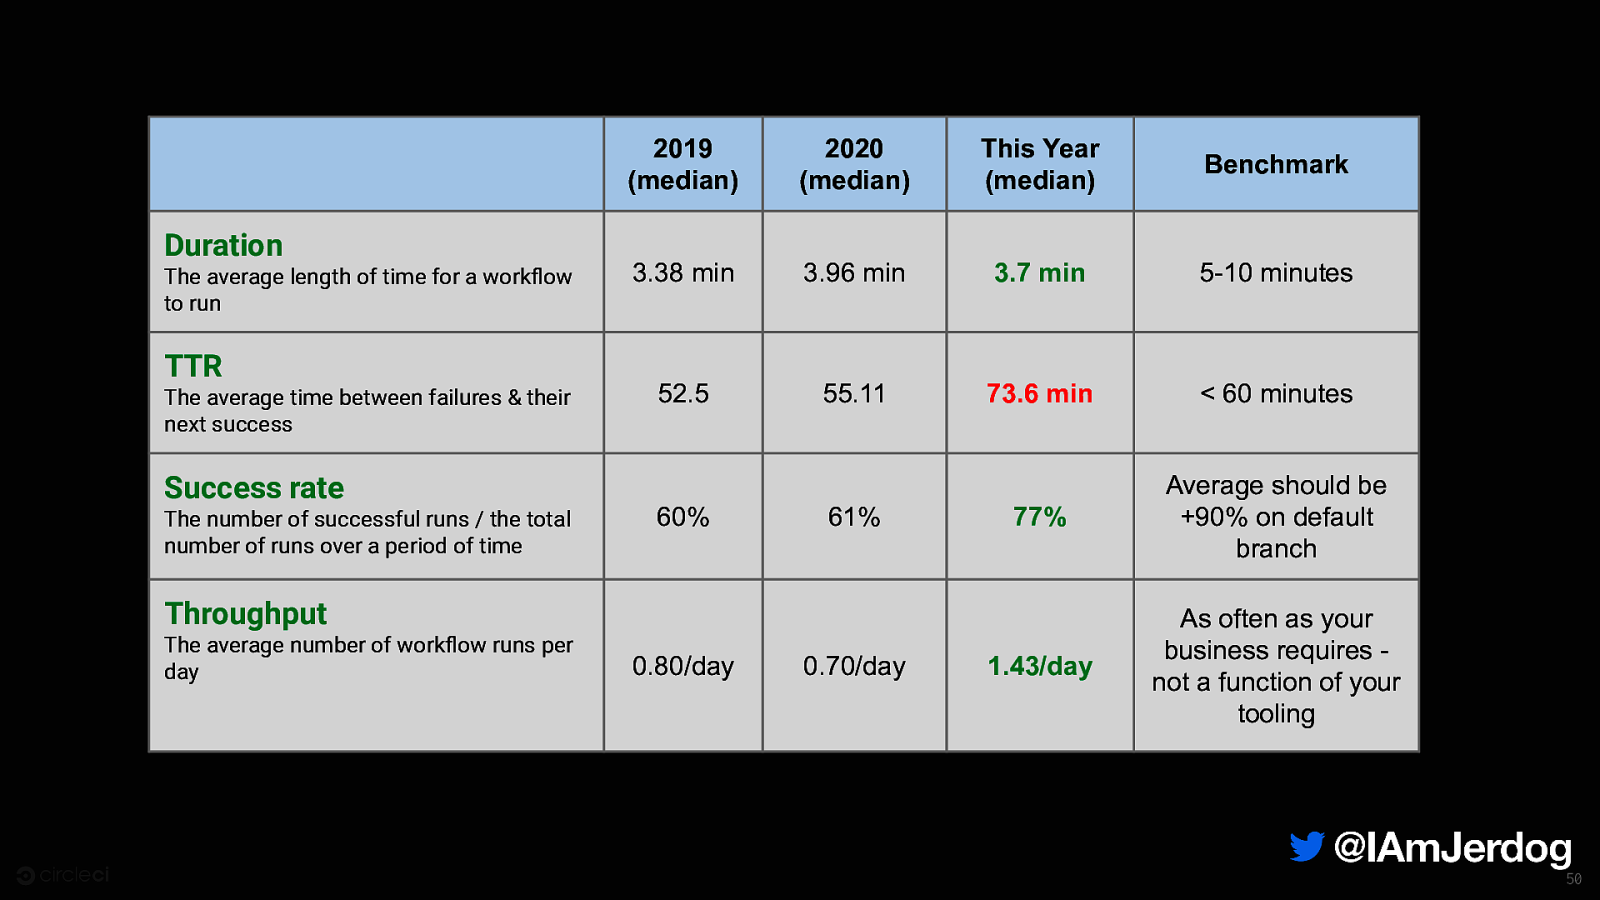
Duration The average length of time for a workflow to run TTR The average time between failures & their next success 2019 (median) 2020 (median) This Year (median) Benchmark 3.38 min 3.96 min 3.7 min 5-10 minutes 52.5 55.11 73.6 min < 60 minutes 77% Average should be +90% on default branch 1.43/day As often as your business requires not a function of your tooling Success rate The number of successful runs / the total number of runs over a period of time 60% 61% Throughput The average number of workflow runs per day 0.80/day 0.70/day 50

51
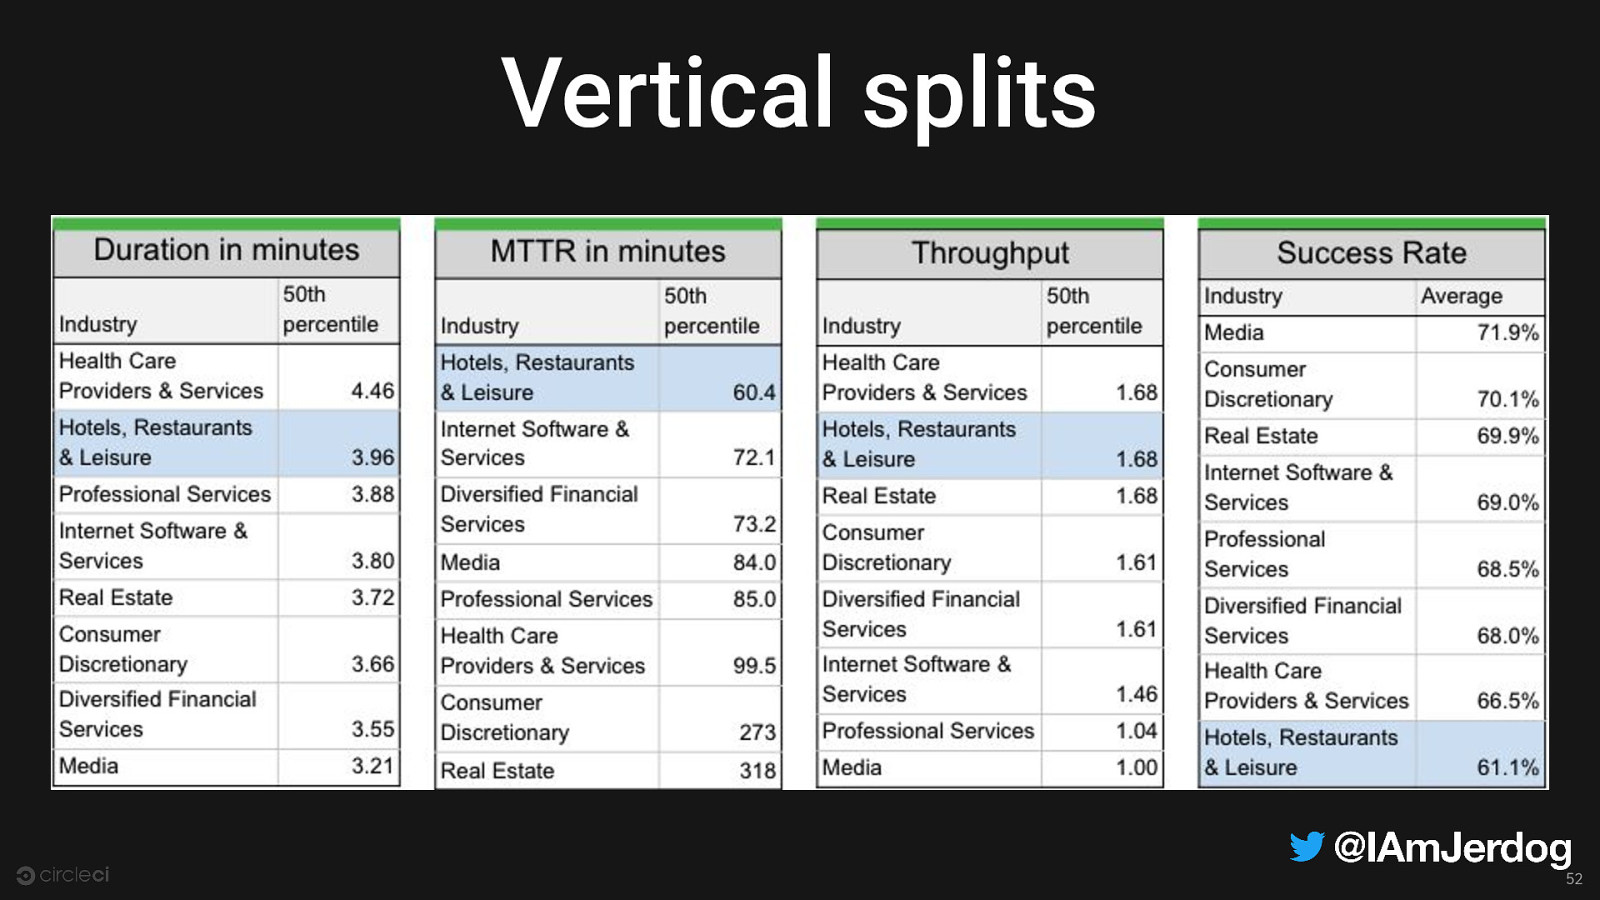
Vertical splits 52
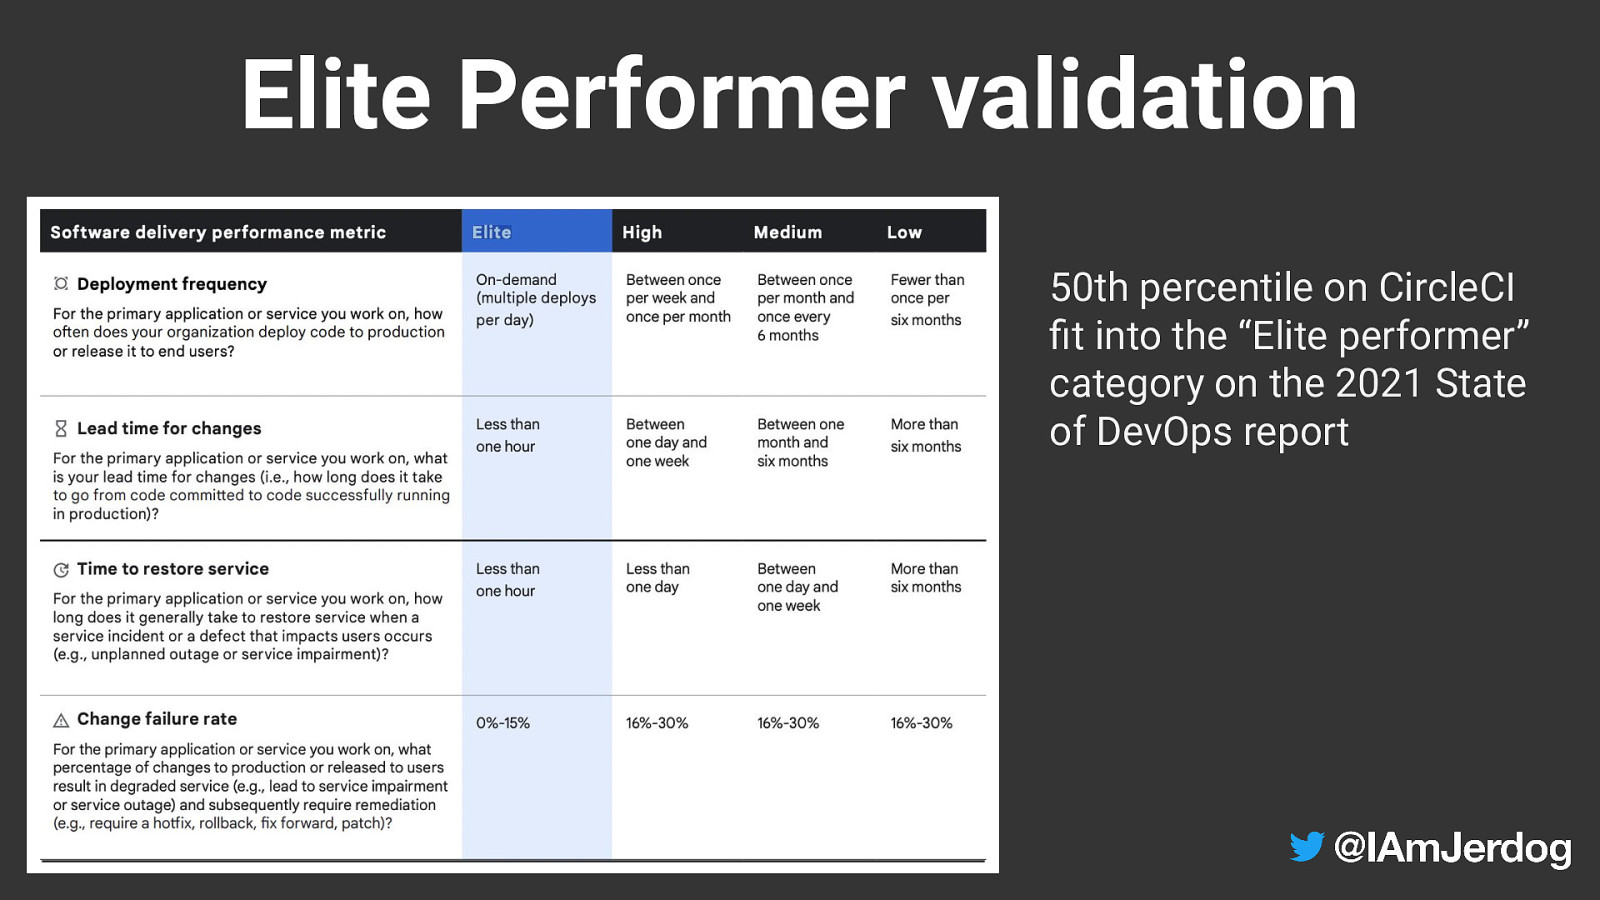
Elite Performer validation 50th percentile on CircleCI fit into the “Elite performer” category on the 2021 State of DevOps report

2020 Report Full 2022 Report https://circle.ci/ssd2020 https://circle.ci/ssd2022 54

Sony WF-1000XM4 Wireless Noise Canceling Earphones & Yamazaki 12 Years The winner will be notified by email on Sept 8, 2022 Single Malt Whiskey
Timeline.jerdog.me Thank you. For feedback and swag: circle.ci/jeremy IAmJerdog jerdog /in/jeremymeiss

Since early 2020, software delivery has undergone quite a shift in process and practices and how we understand “high-performing engineering teams.” With anonymous data collected from over 1M+ devs, 45K+ orgs, and 250M+ workflows, we’ve found some interesting insights into better DevOps practices. In this session, we will seek to uncover what this unique dataset can tell us about high-performing teams, and steps to get there as a business.
Video
Buzz and feedback
Here’s what was said about this presentation on social media.