What a global pandemic can tell you about better DevOps practices
A presentation at ConFoo 2022 in in Montreal, QC, Canada by Jeremy Meiss

DevOps & Software Delivery in a Global Pandemic
“
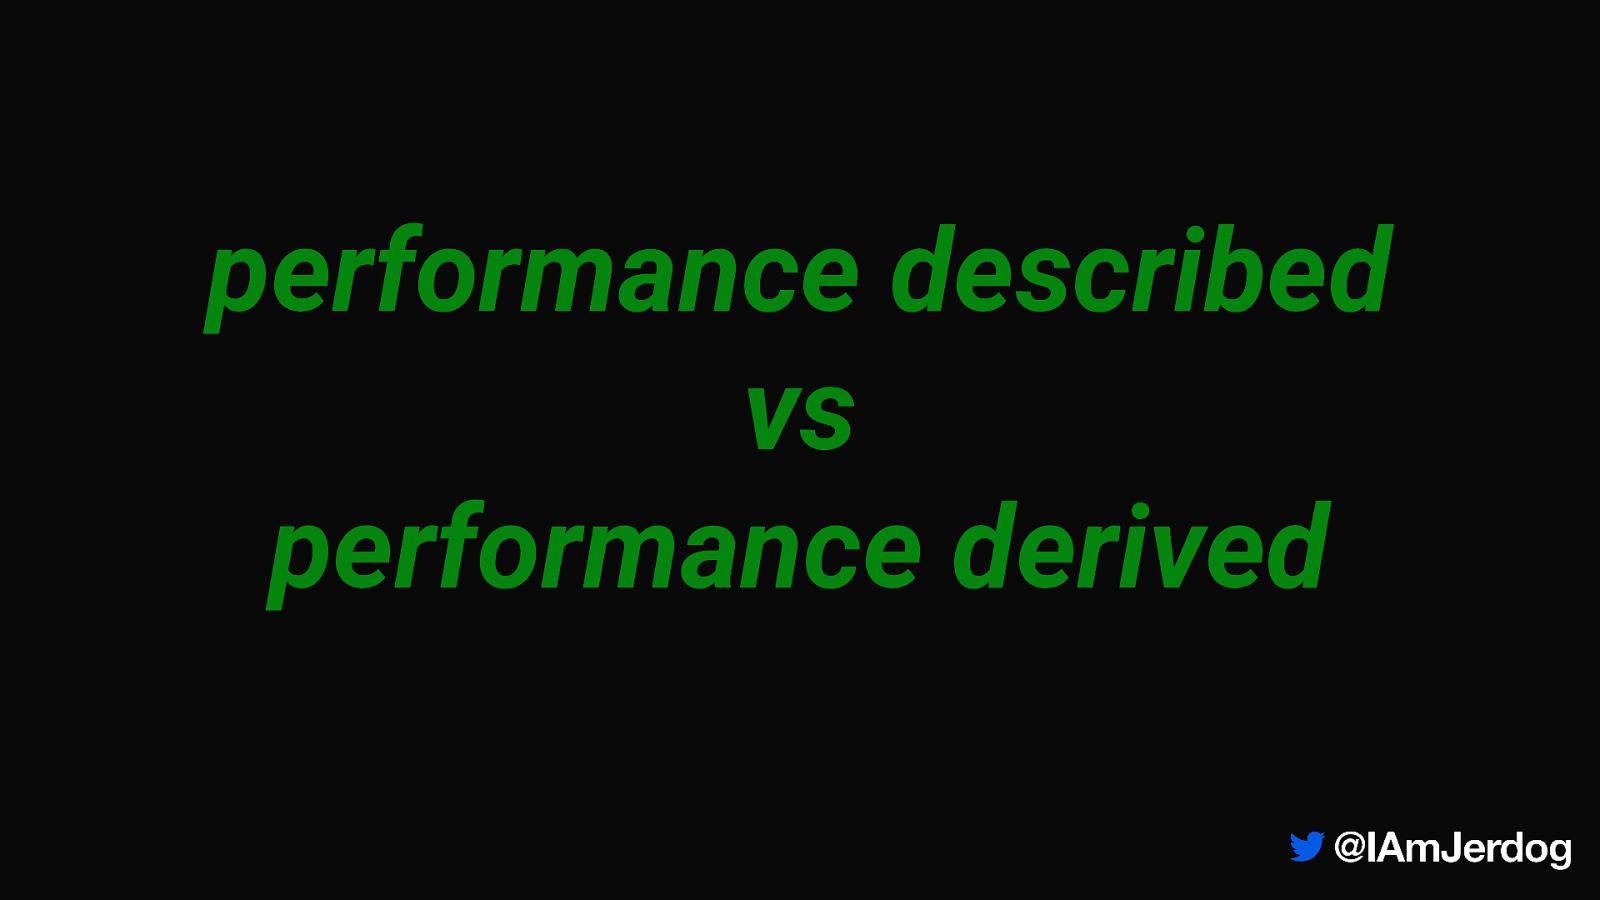
performance described vs performance derived

Jeremy Meiss Director, DevRel & Community
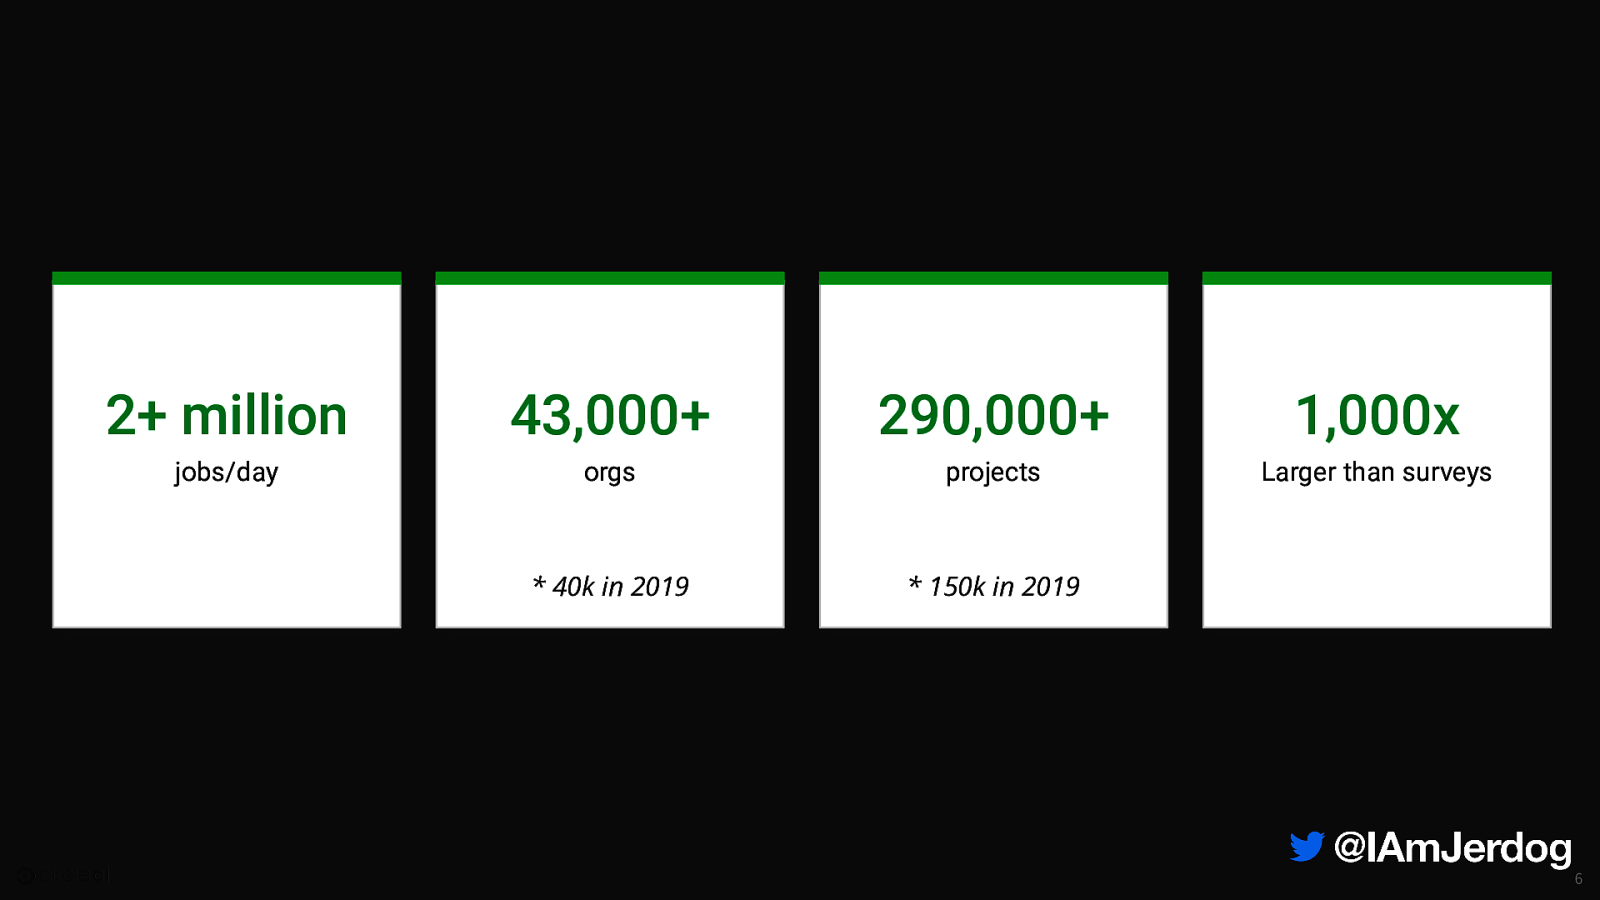
2+ million 43,000+ 290,000+ 1,000x jobs/day orgs projects Larger than surveys
- 40k in 2019
- 150k in 2019 6
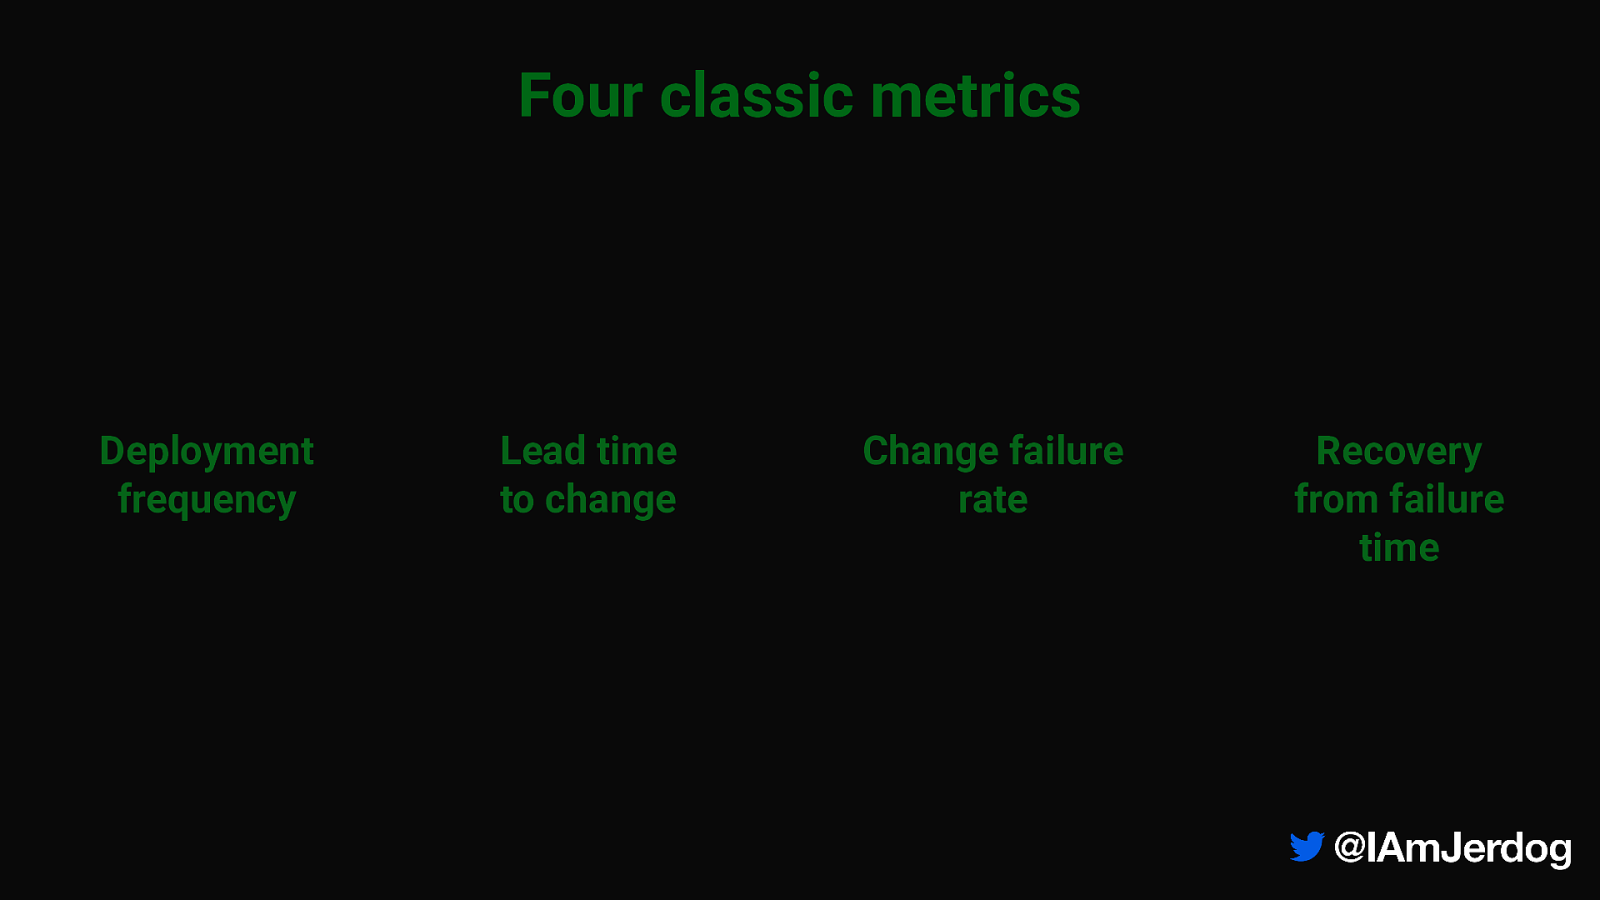
Four classic metrics Deployment frequency Lead time to change Change failure rate Recovery from failure time
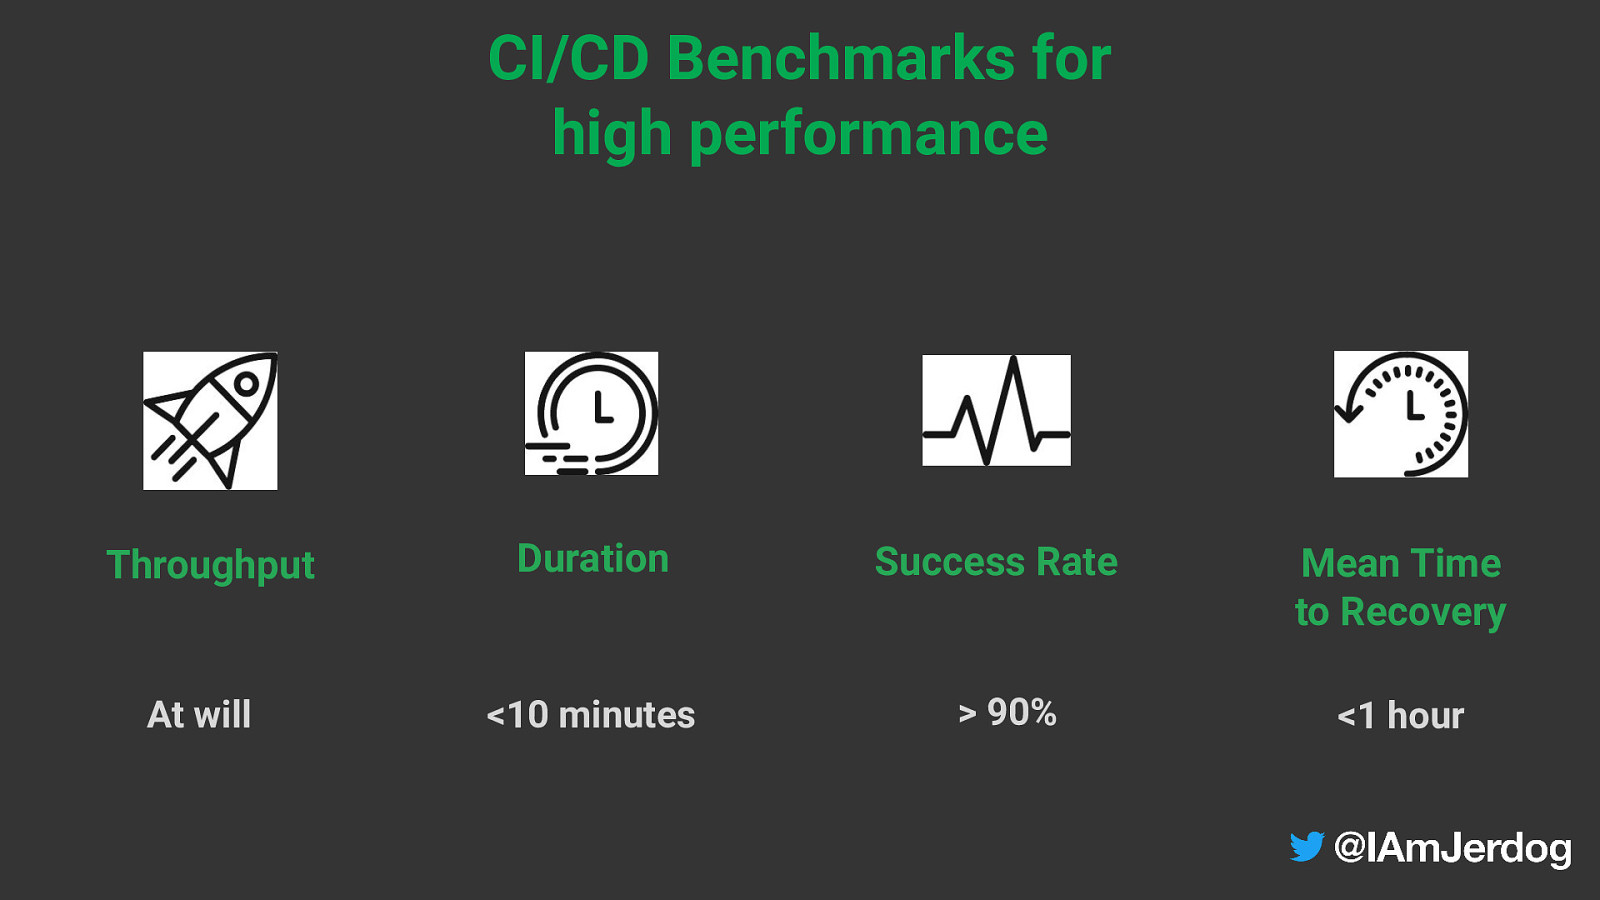
CI/CD Benchmarks for high performance Throughput At will Duration <10 minutes Success Rate
90% Mean Time to Recovery <1 hour

The Data

Photo by: Matthew Henry
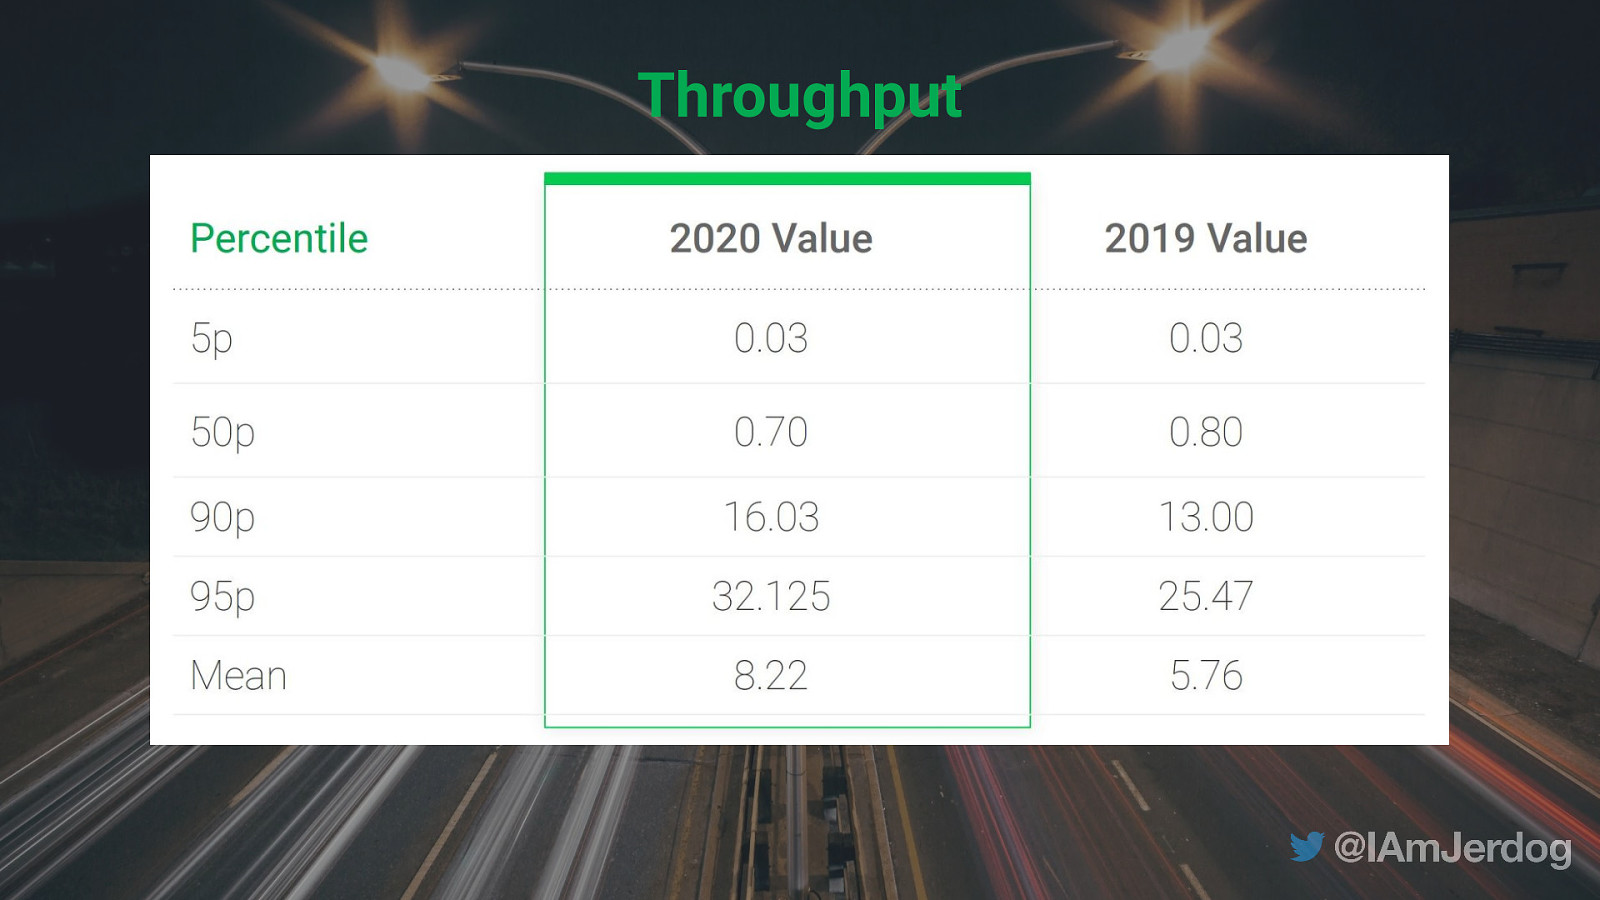
Throughput
Most teams are not deploying dozens of times per day

Image by Pawan Kolhe from Pixabay
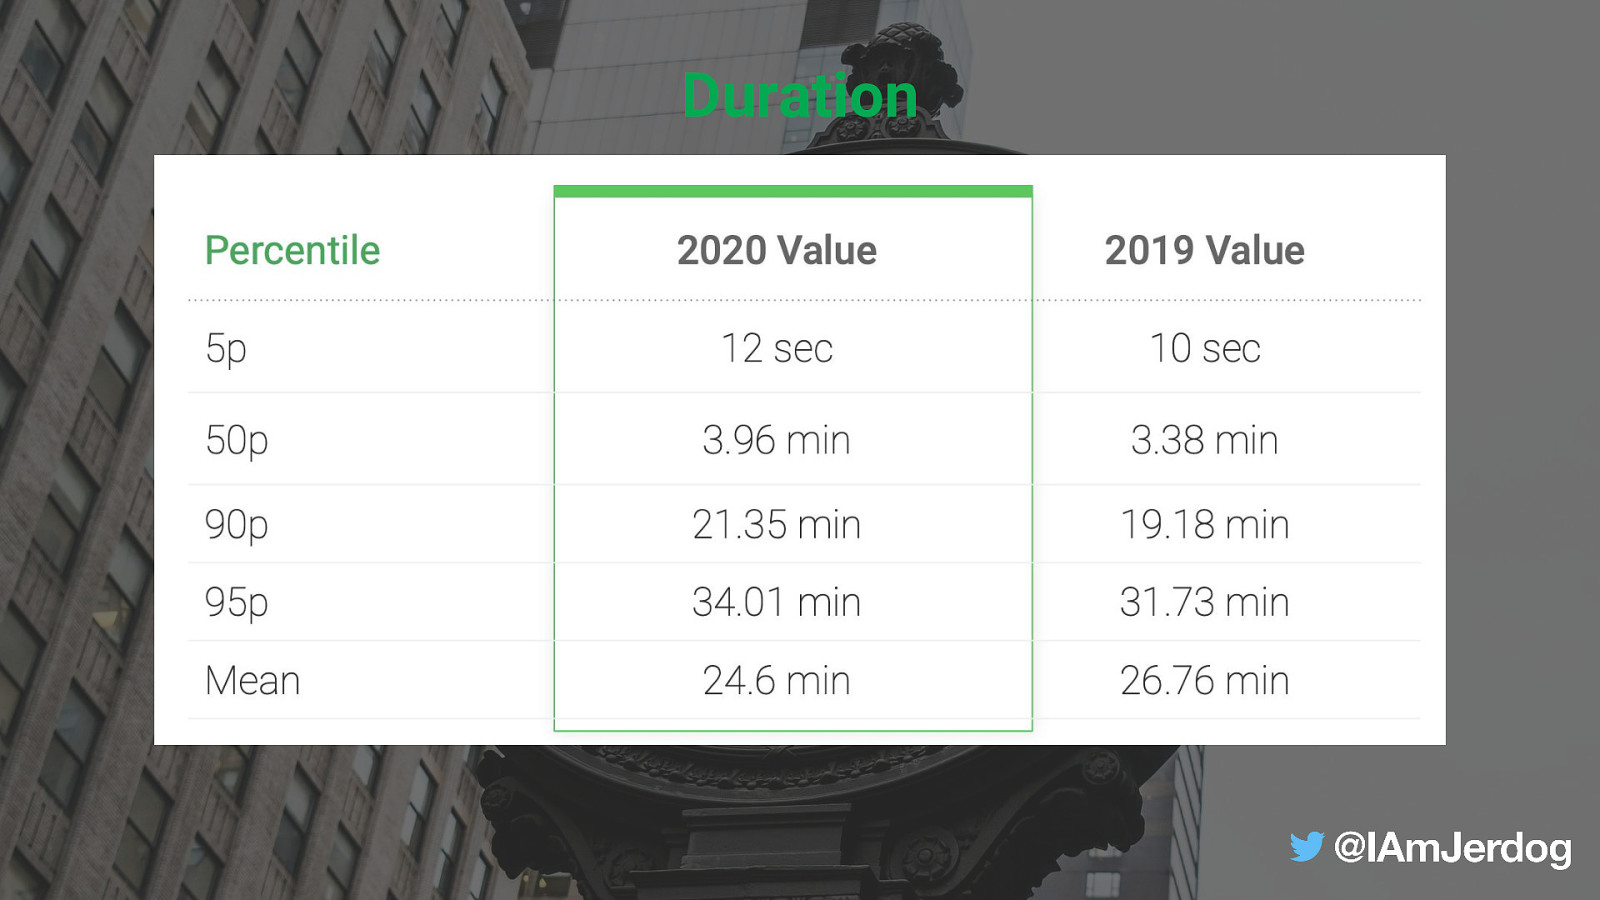
Duration

Photo by Lukas from Pexels
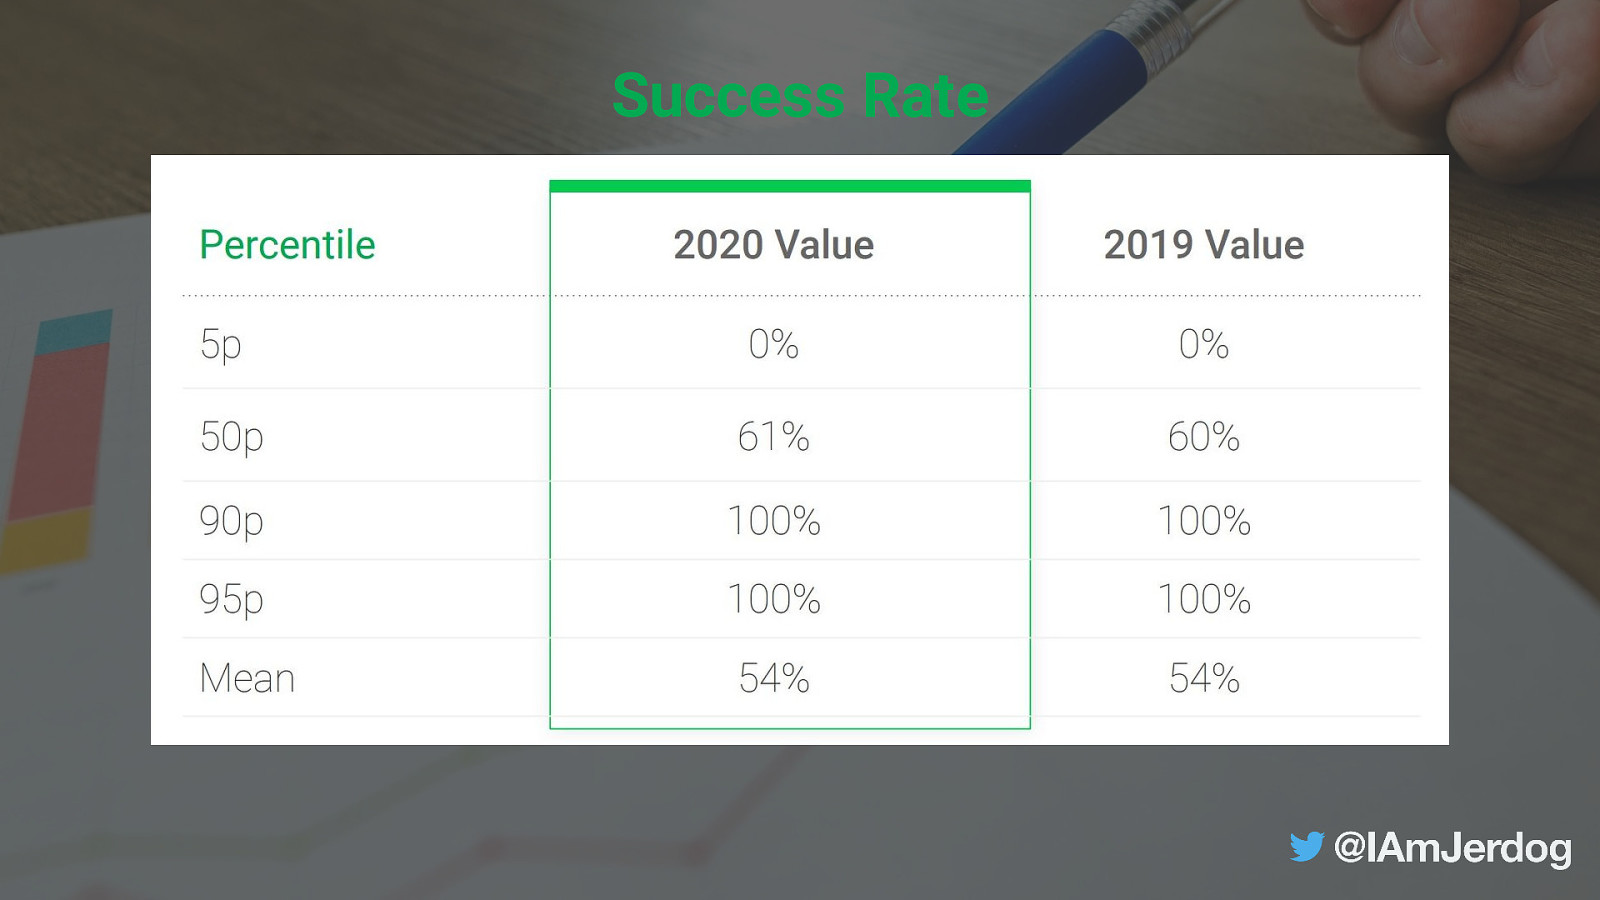
Success Rate

Photo by Brett Sayles from Pexels

Recovery Time
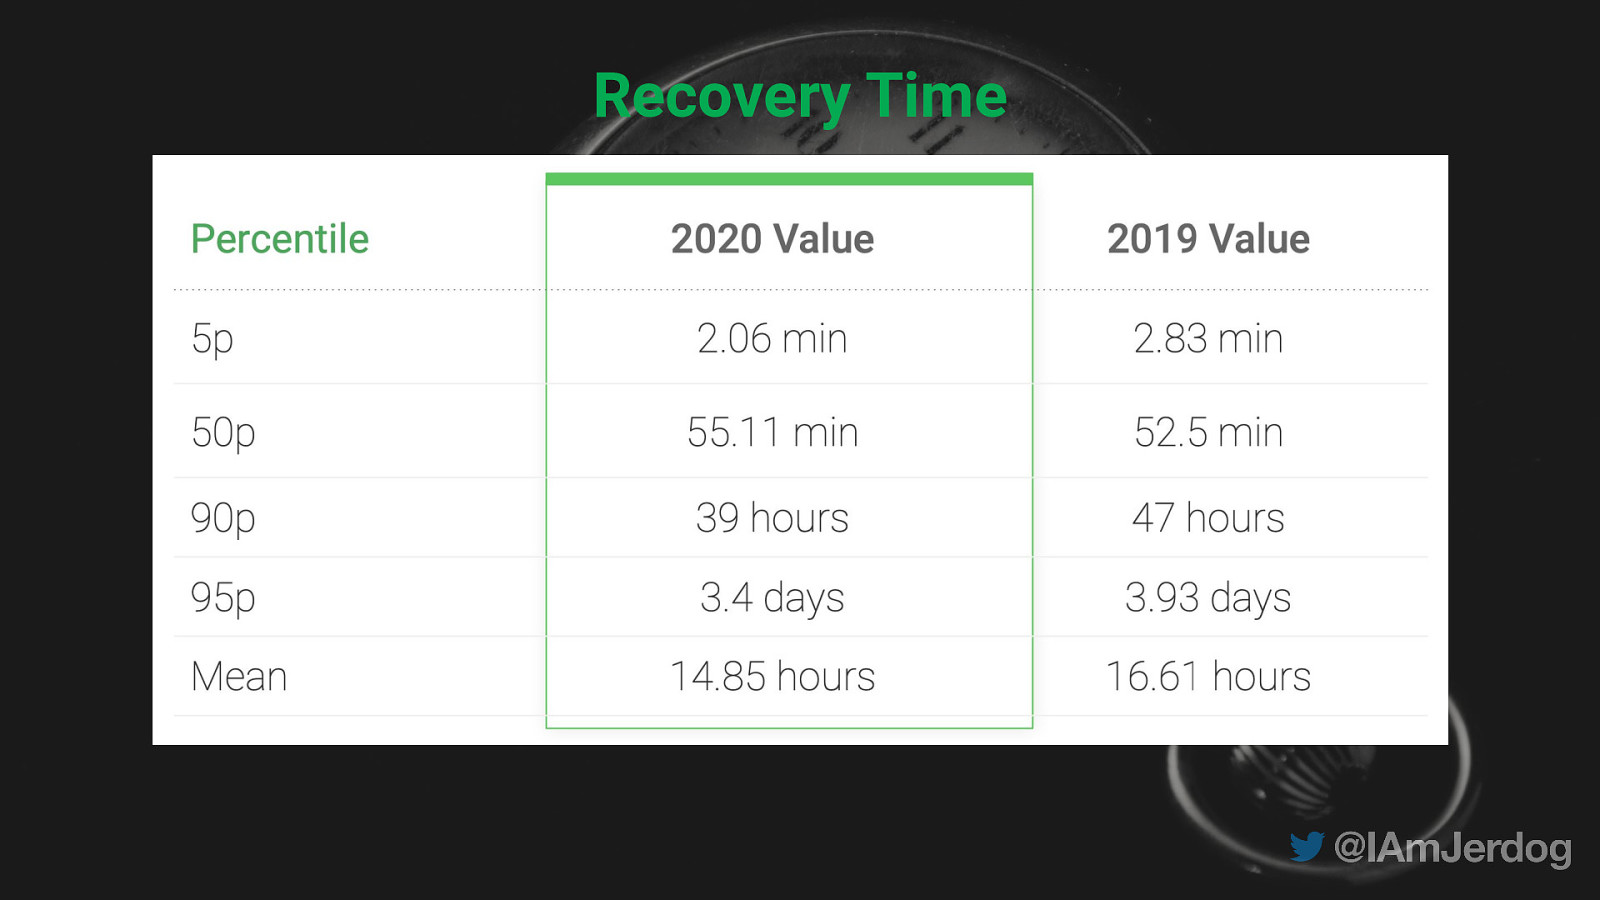
Recovery Time

Recovery Time

The Insight

2020/21 was quite a timeline.

Throughput
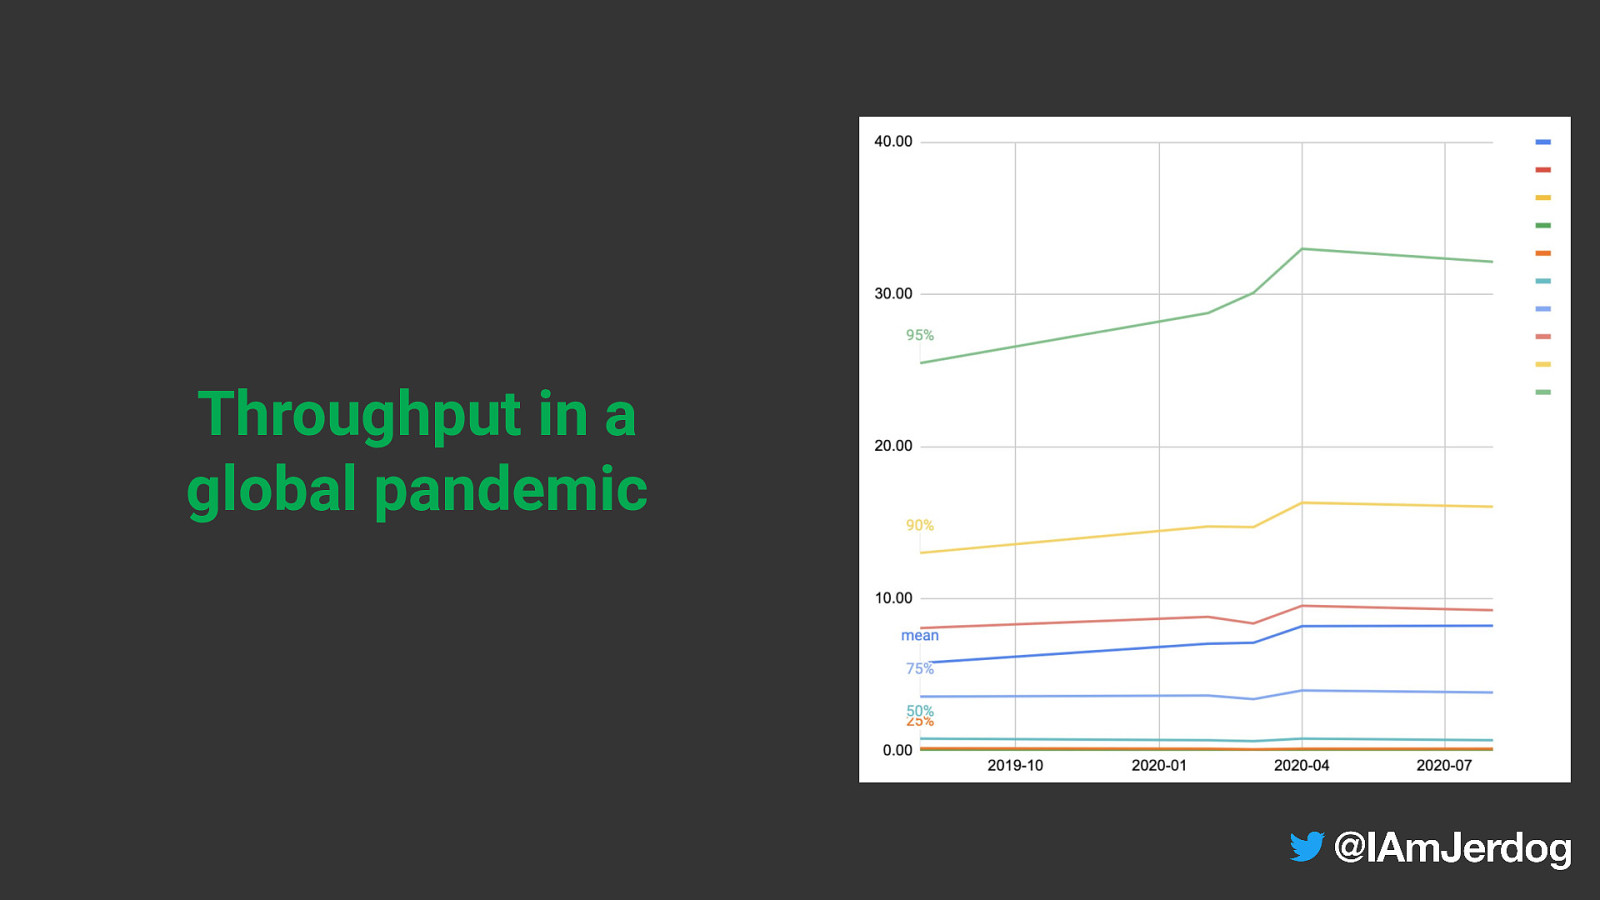
Throughput in a global pandemic

Peak Throughput was in April 2020

Duration
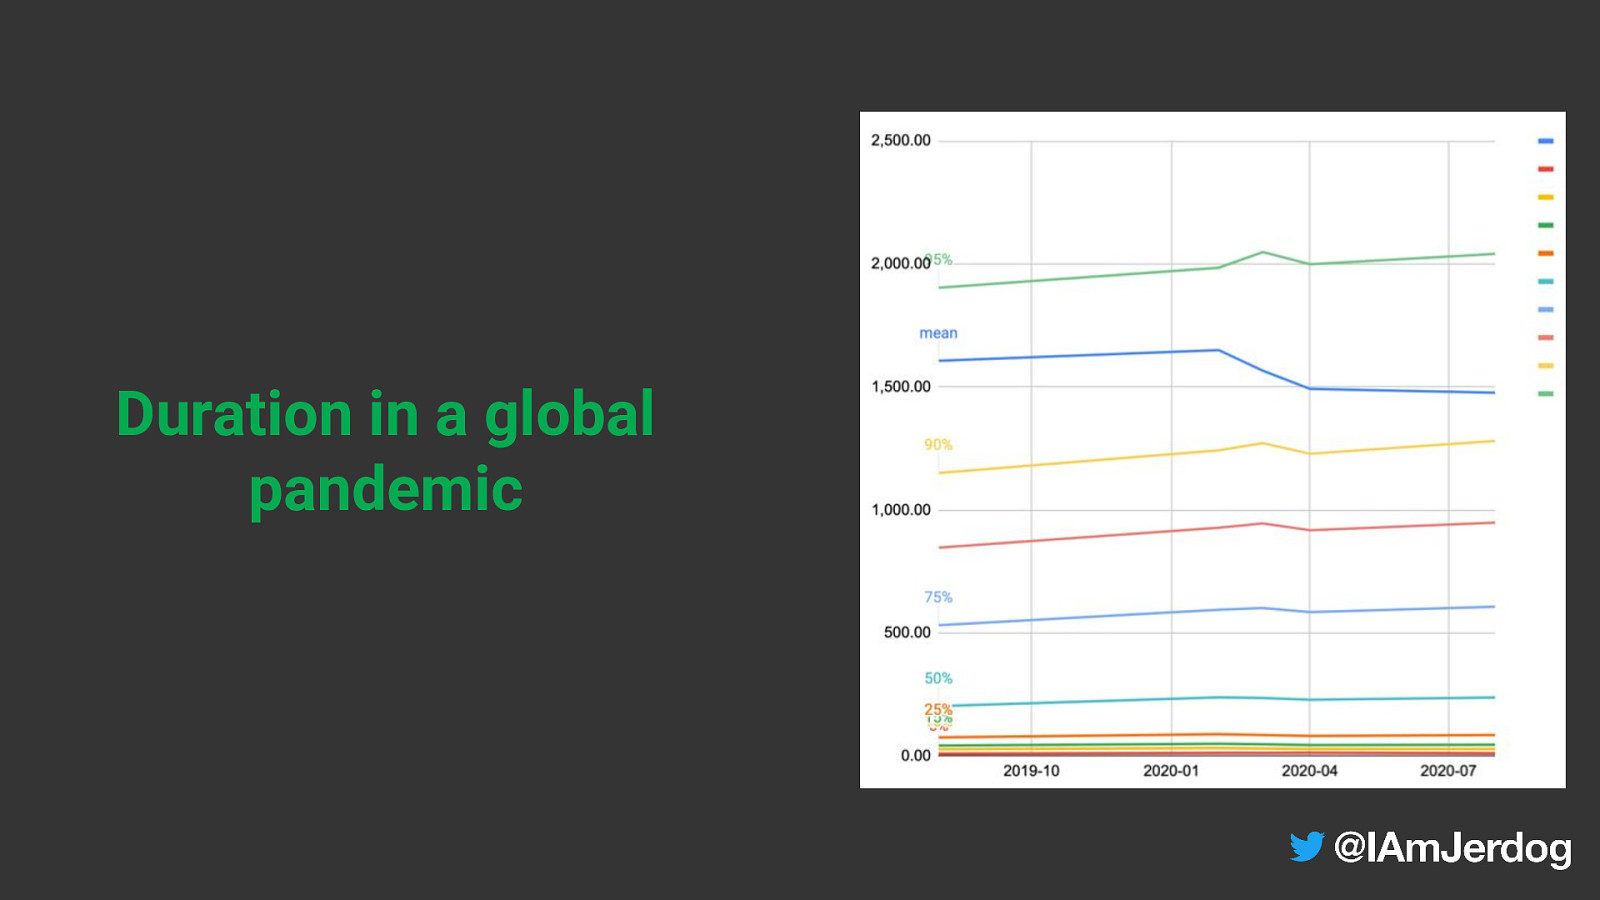
Duration in a global pandemic
Hypothesis: more tests written in March, driving up Duration. In April, a concerted effort on optimization
Success rate

Success rate in a global pandemic
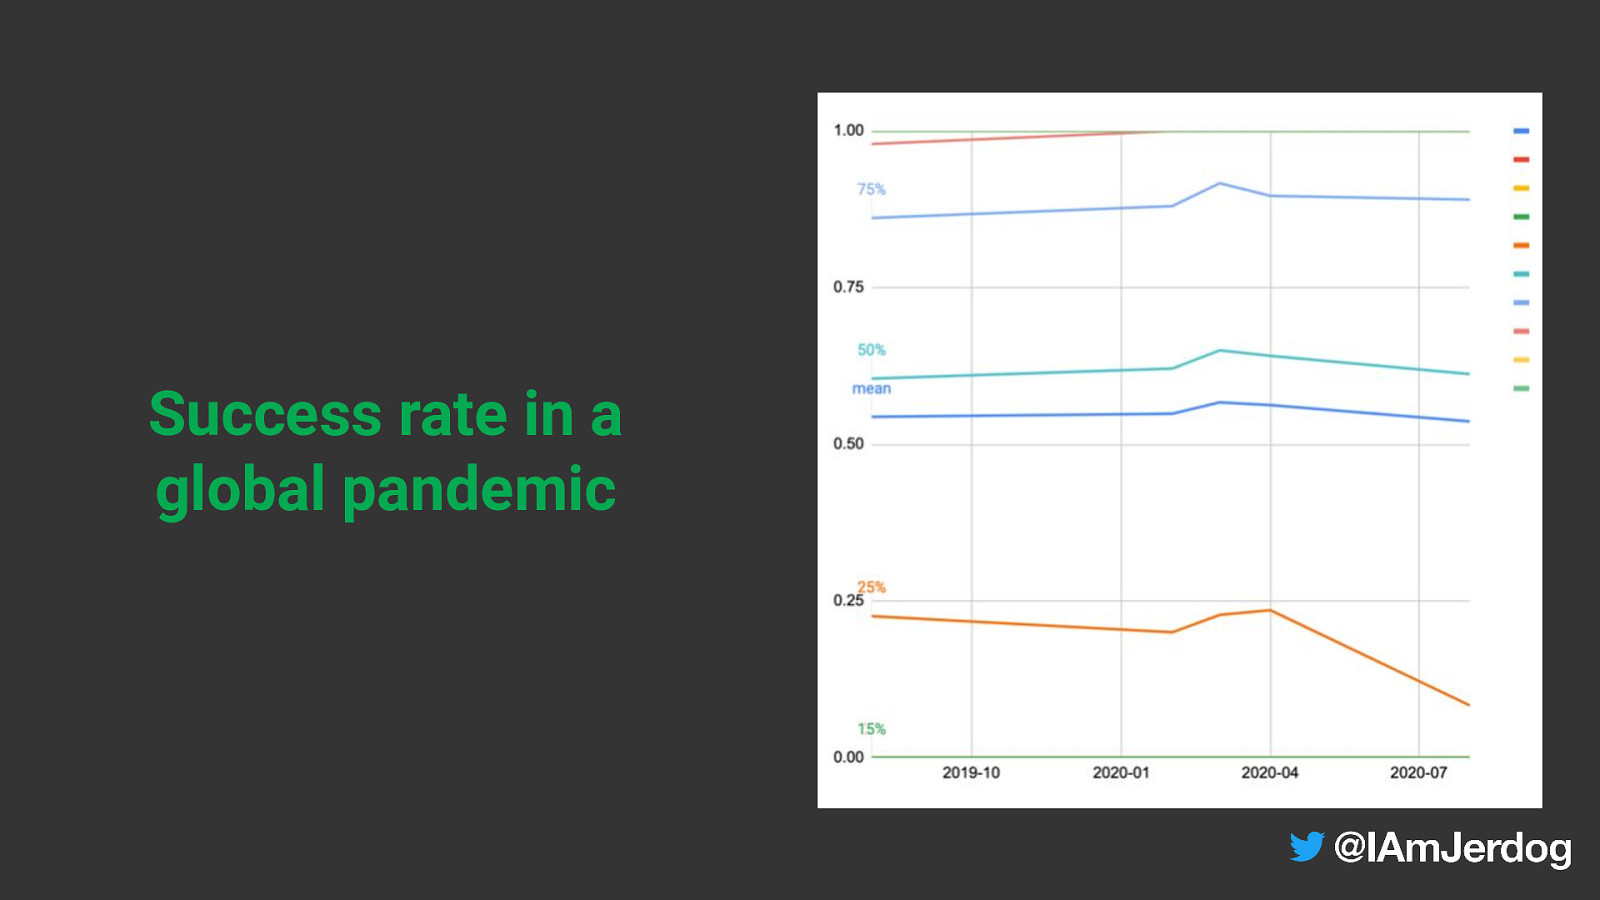
Success rate in a global pandemic

Success rate in a global pandemic

Hypothesis: people working hard on core business stability

Recovery Time
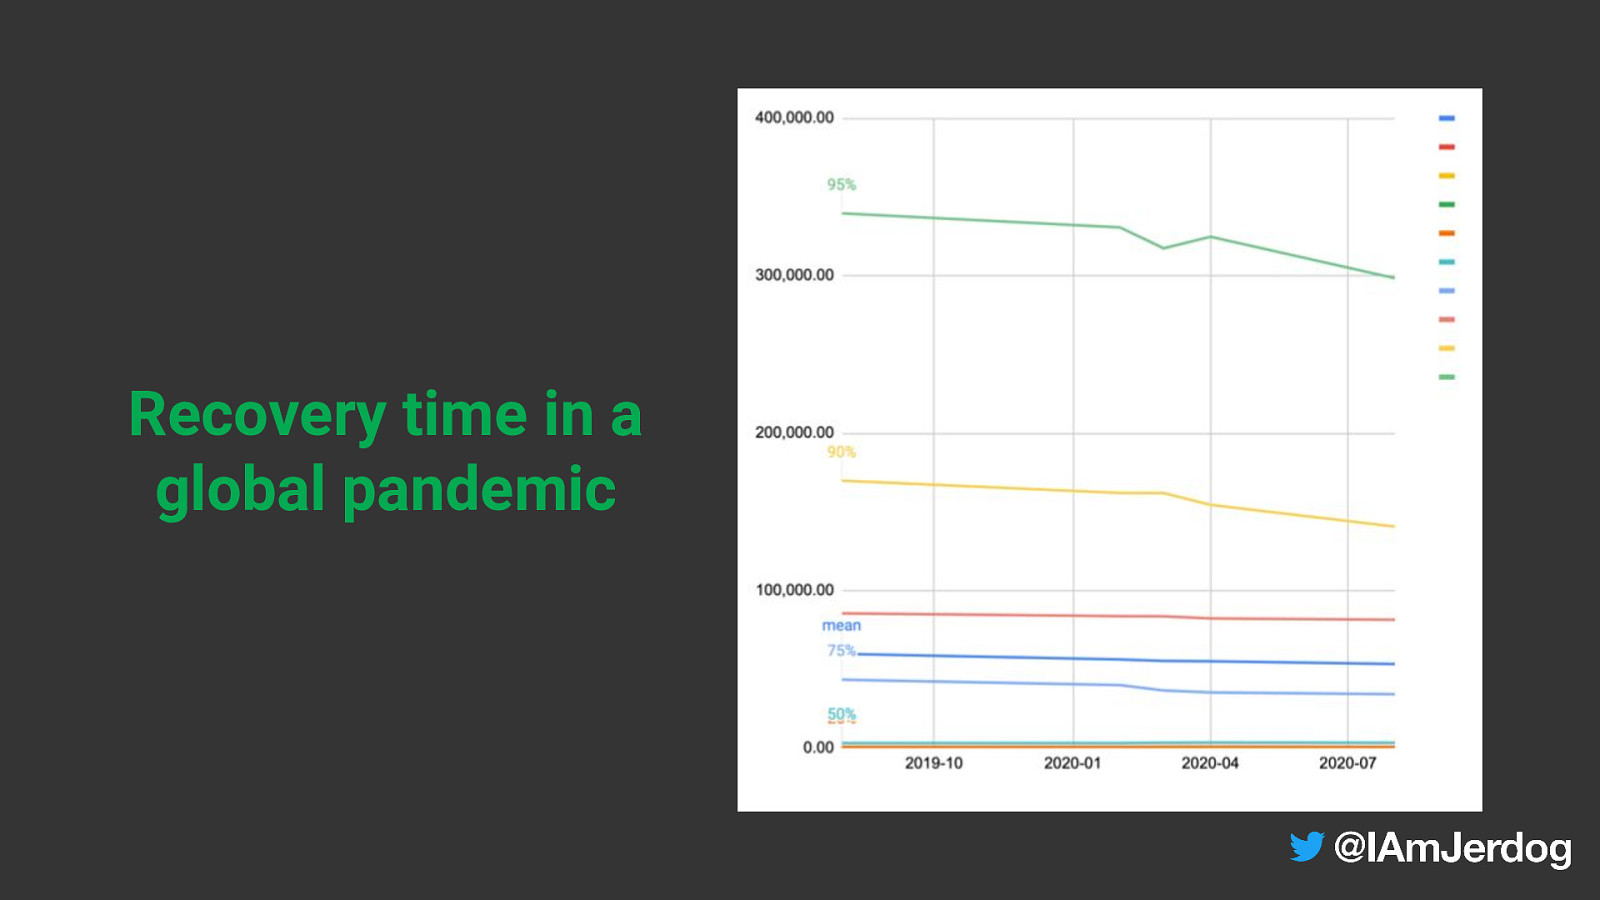
Recovery time in a global pandemic

Hypothesis: few distractions* working at home
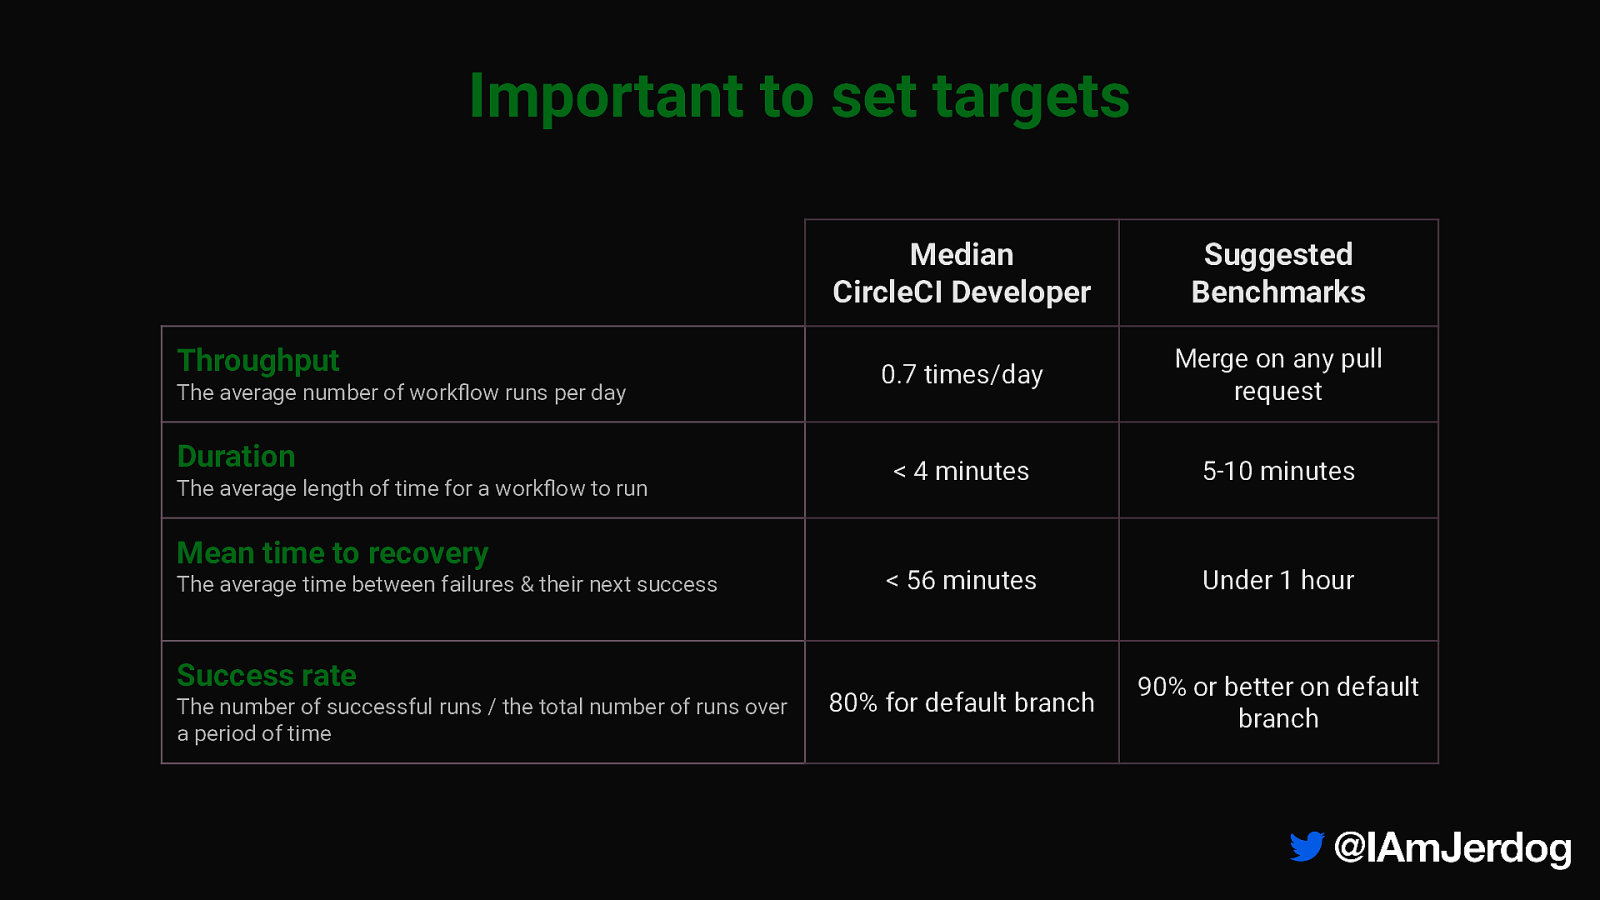
Important to set targets Throughput The average number of workflow runs per day Duration The average length of time for a workflow to run Mean time to recovery The average time between failures & their next success Success rate The number of successful runs / the total number of runs over a period of time Median CircleCI Developer Suggested Benchmarks 0.7 times/day Merge on any pull request < 4 minutes 5-10 minutes < 56 minutes Under 1 hour 80% for default branch 90% or better on default branch

Things that make you go 🤔
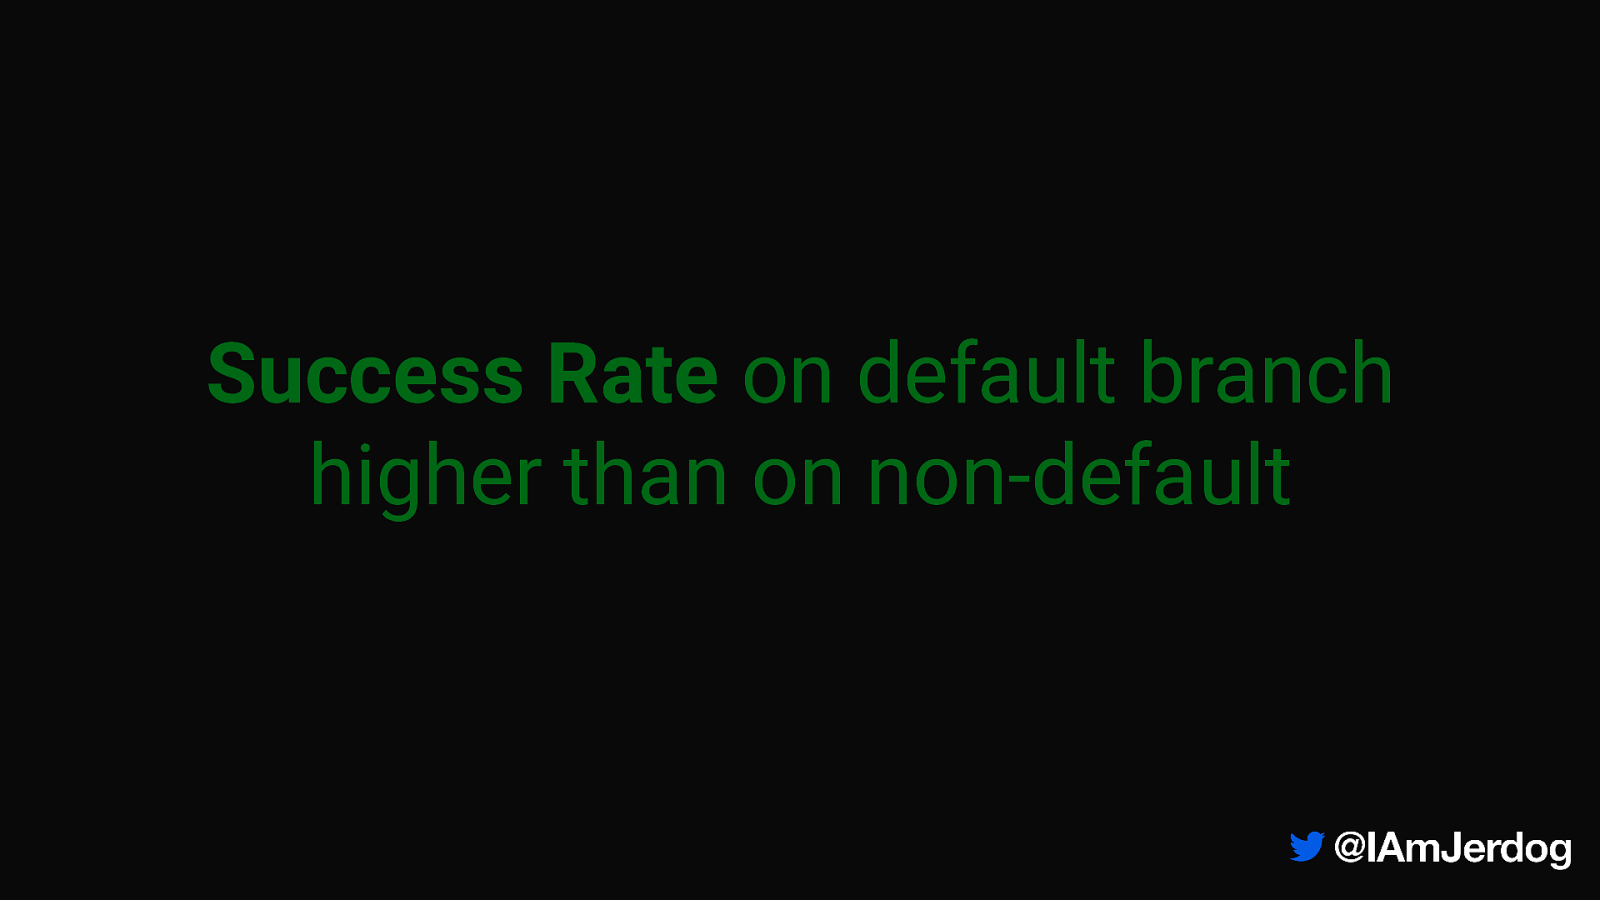
Success Rate on default branch higher than on non-default

Duration on default branches faster at every percentile
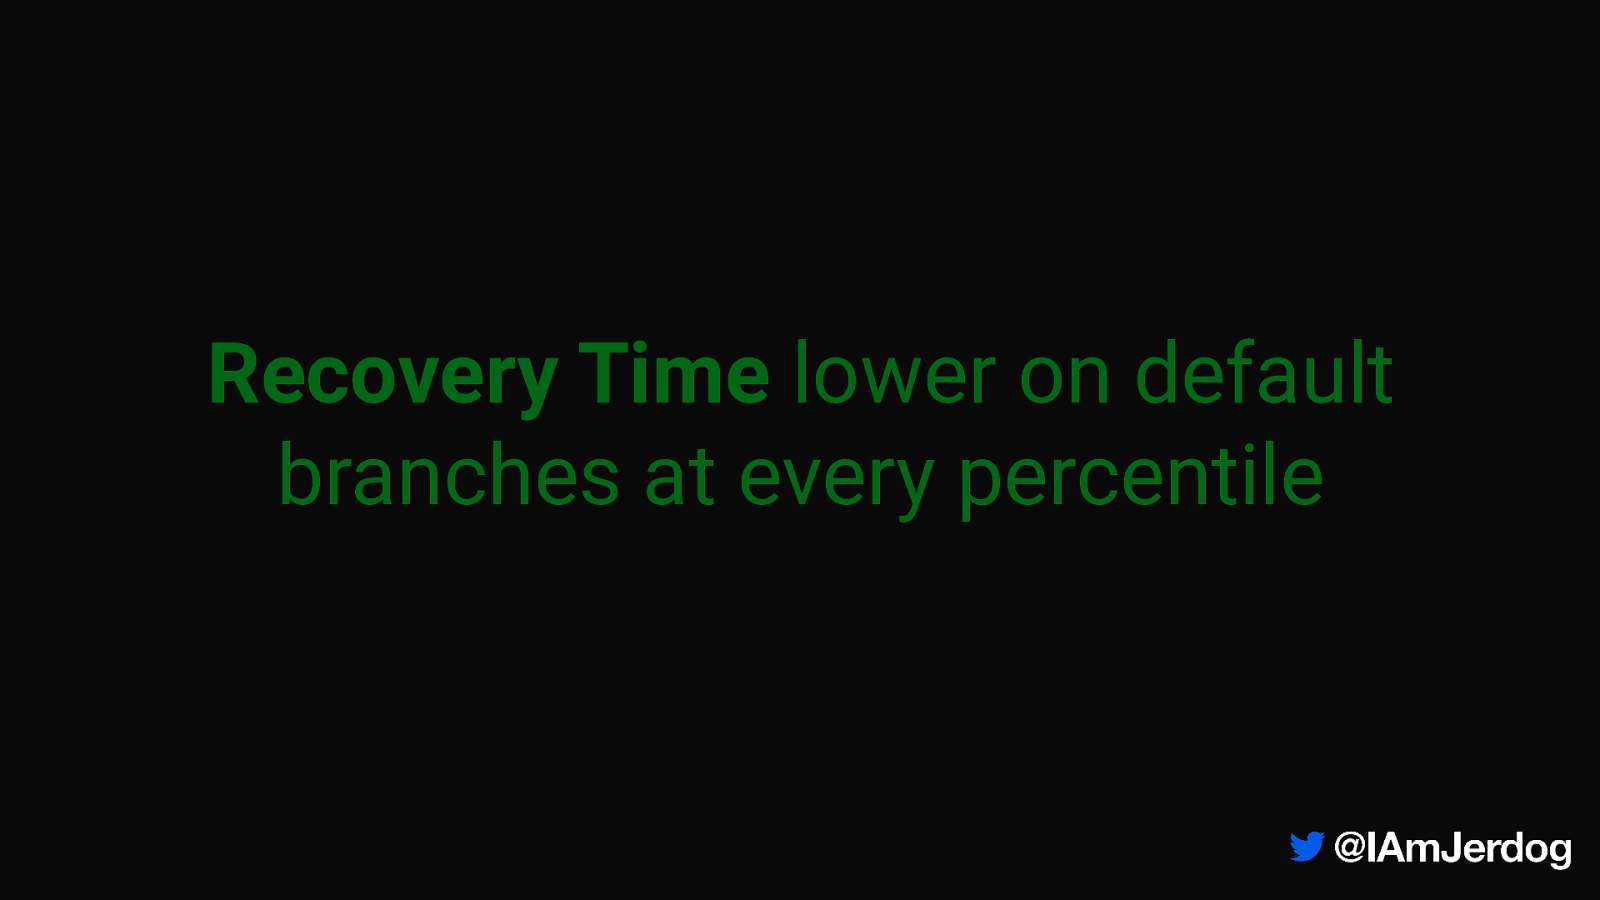
Recovery Time lower on default branches at every percentile

What development practices definitively work?
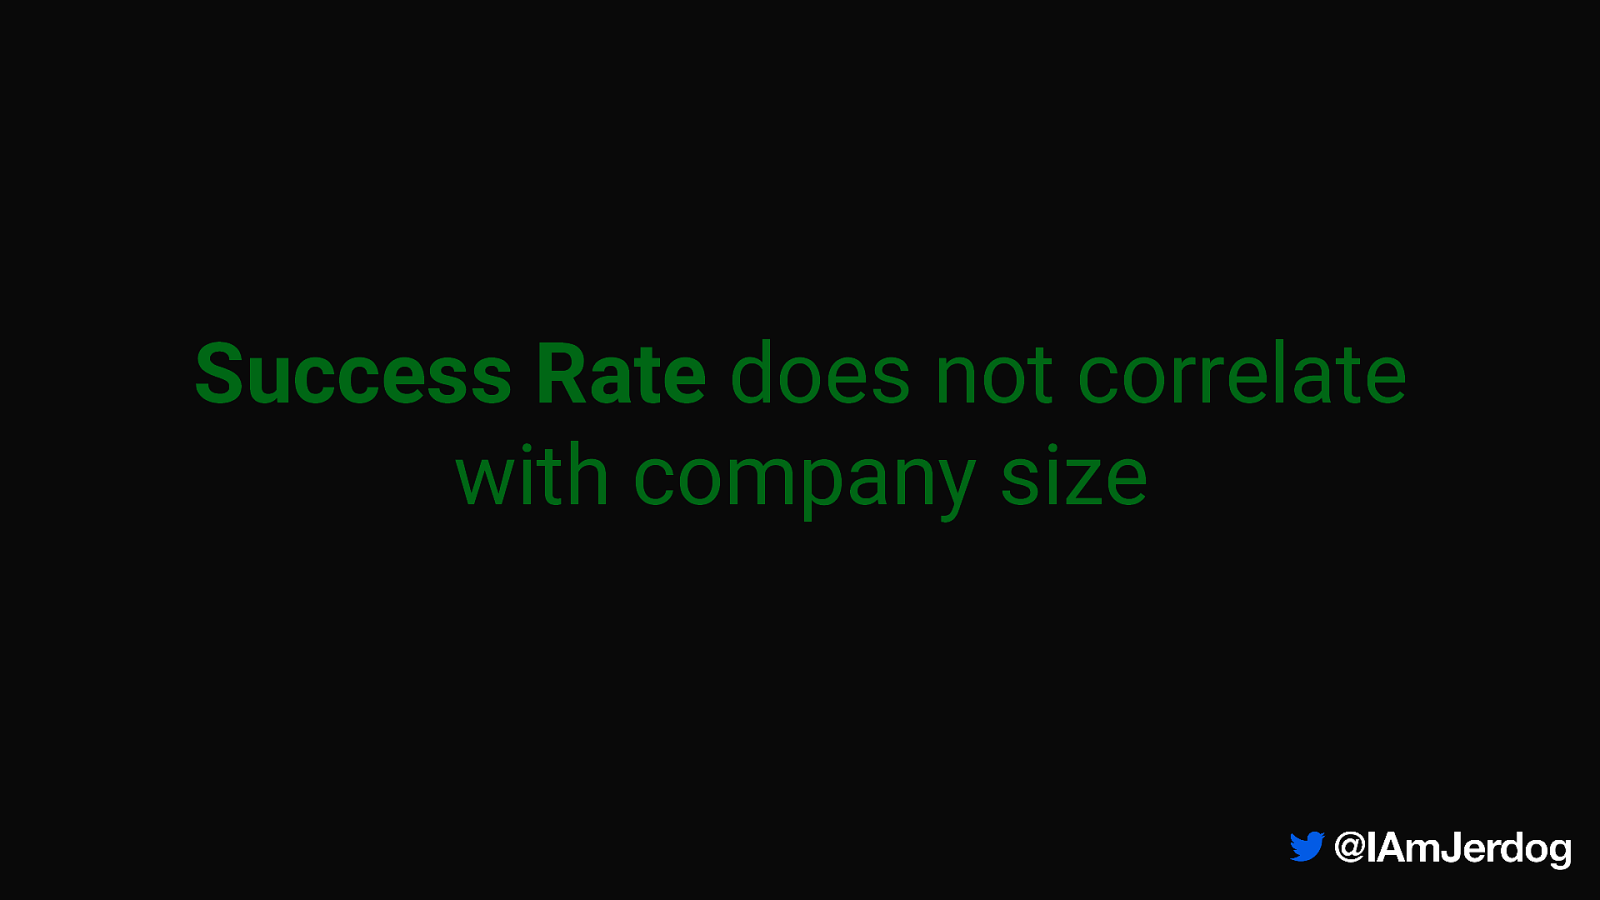
Success Rate does not correlate with company size

Duration is longest for teams of one
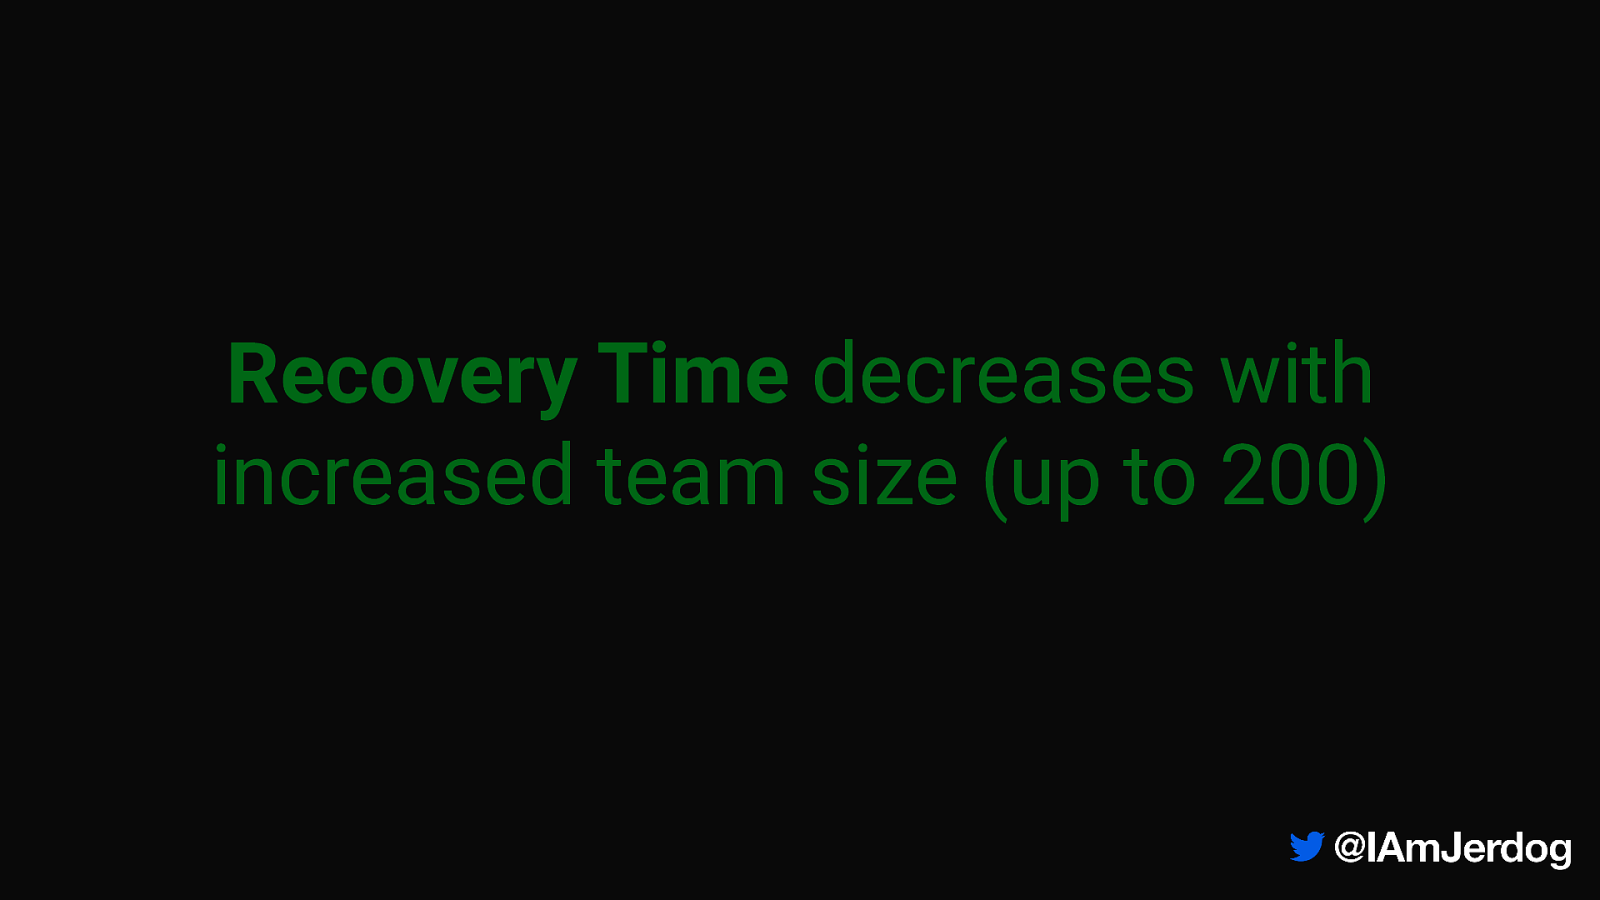
Recovery Time decreases with increased team size (up to 200)
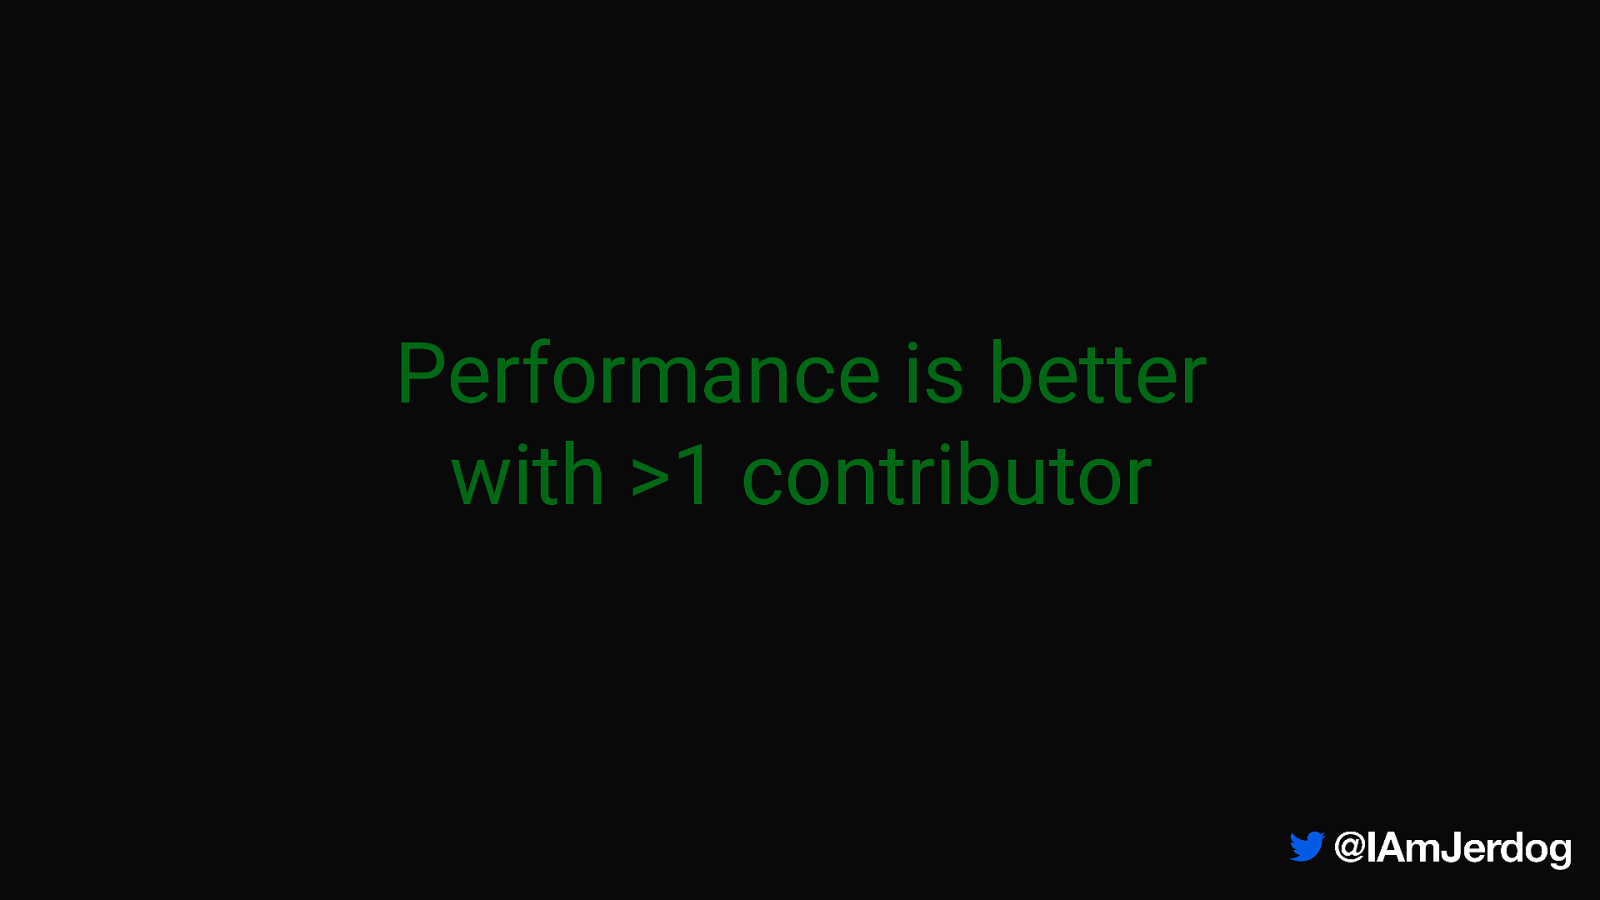
Performance is better with >1 contributor
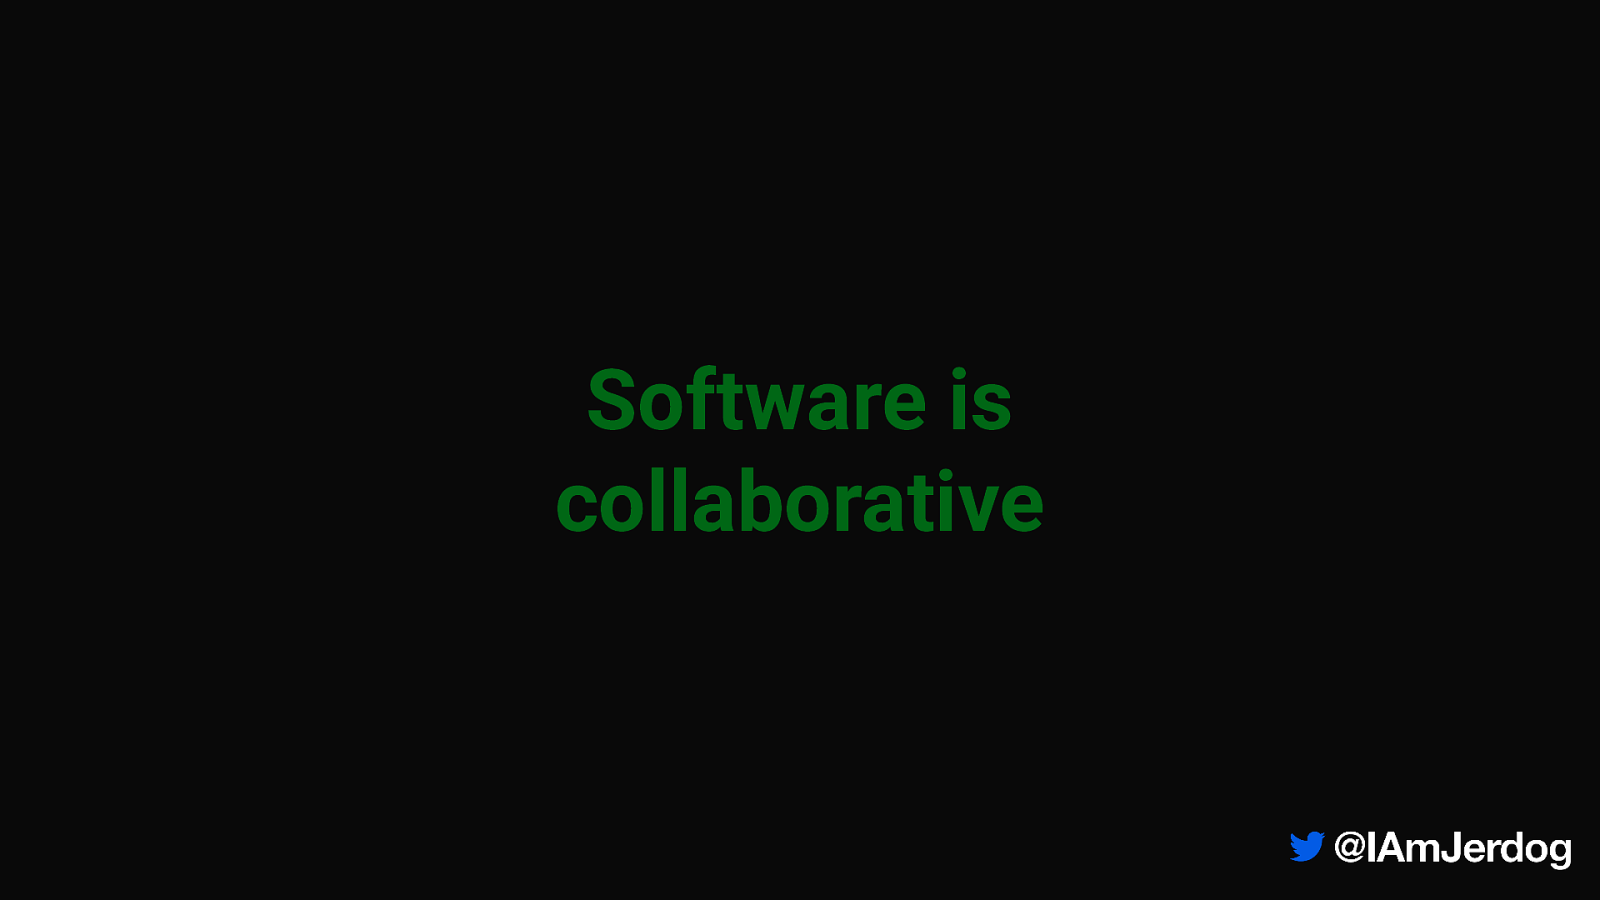
Software is collaborative
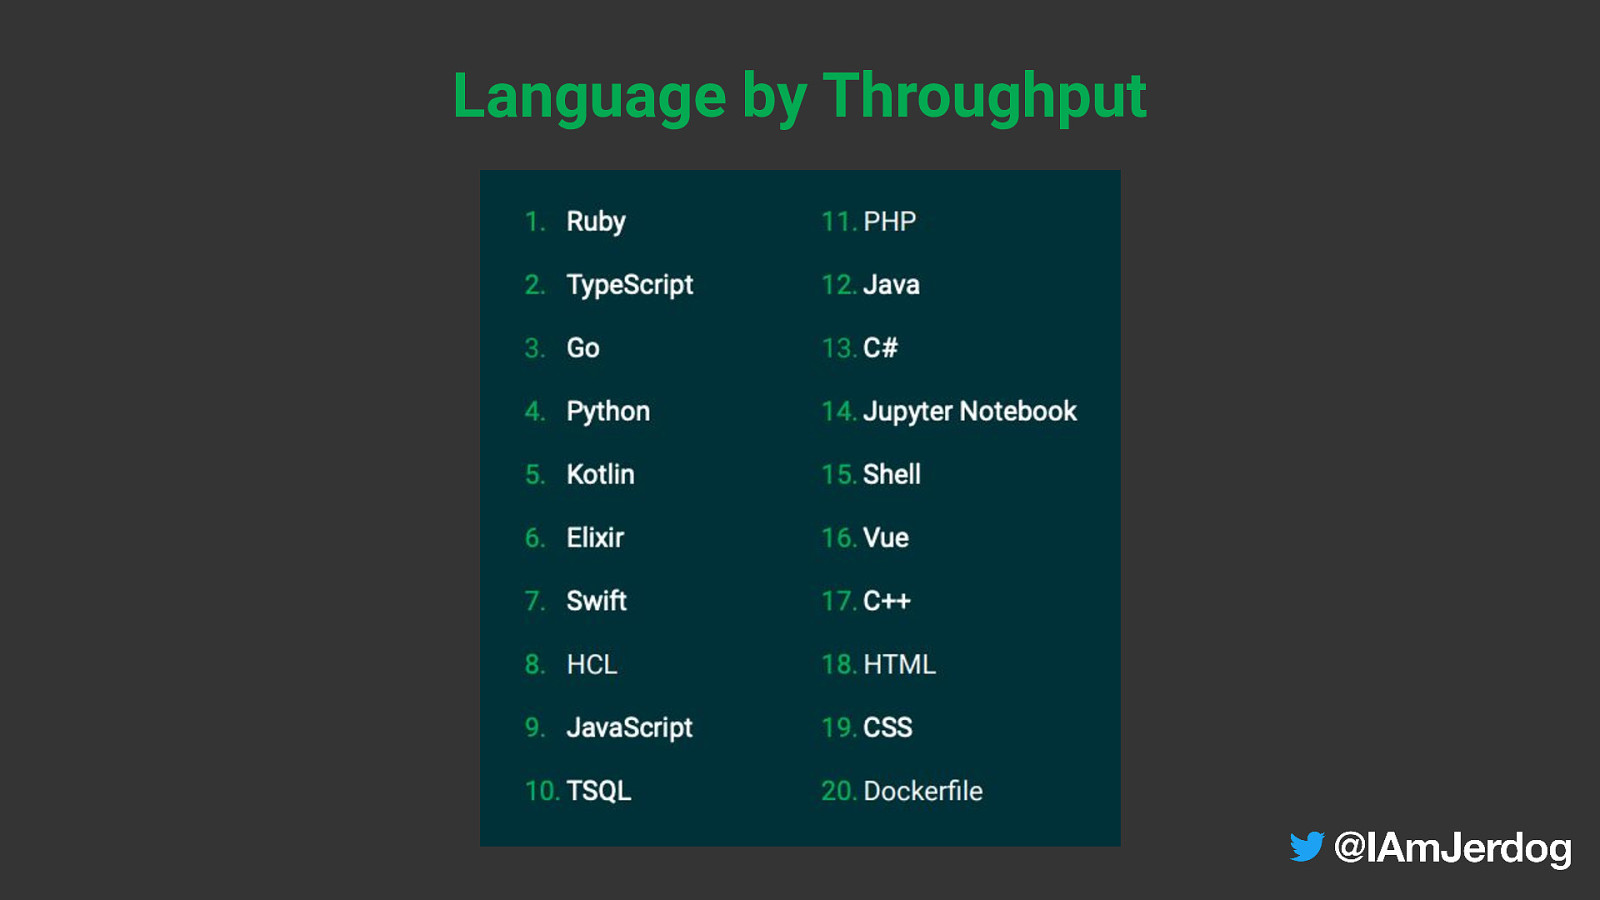
Language by Throughput
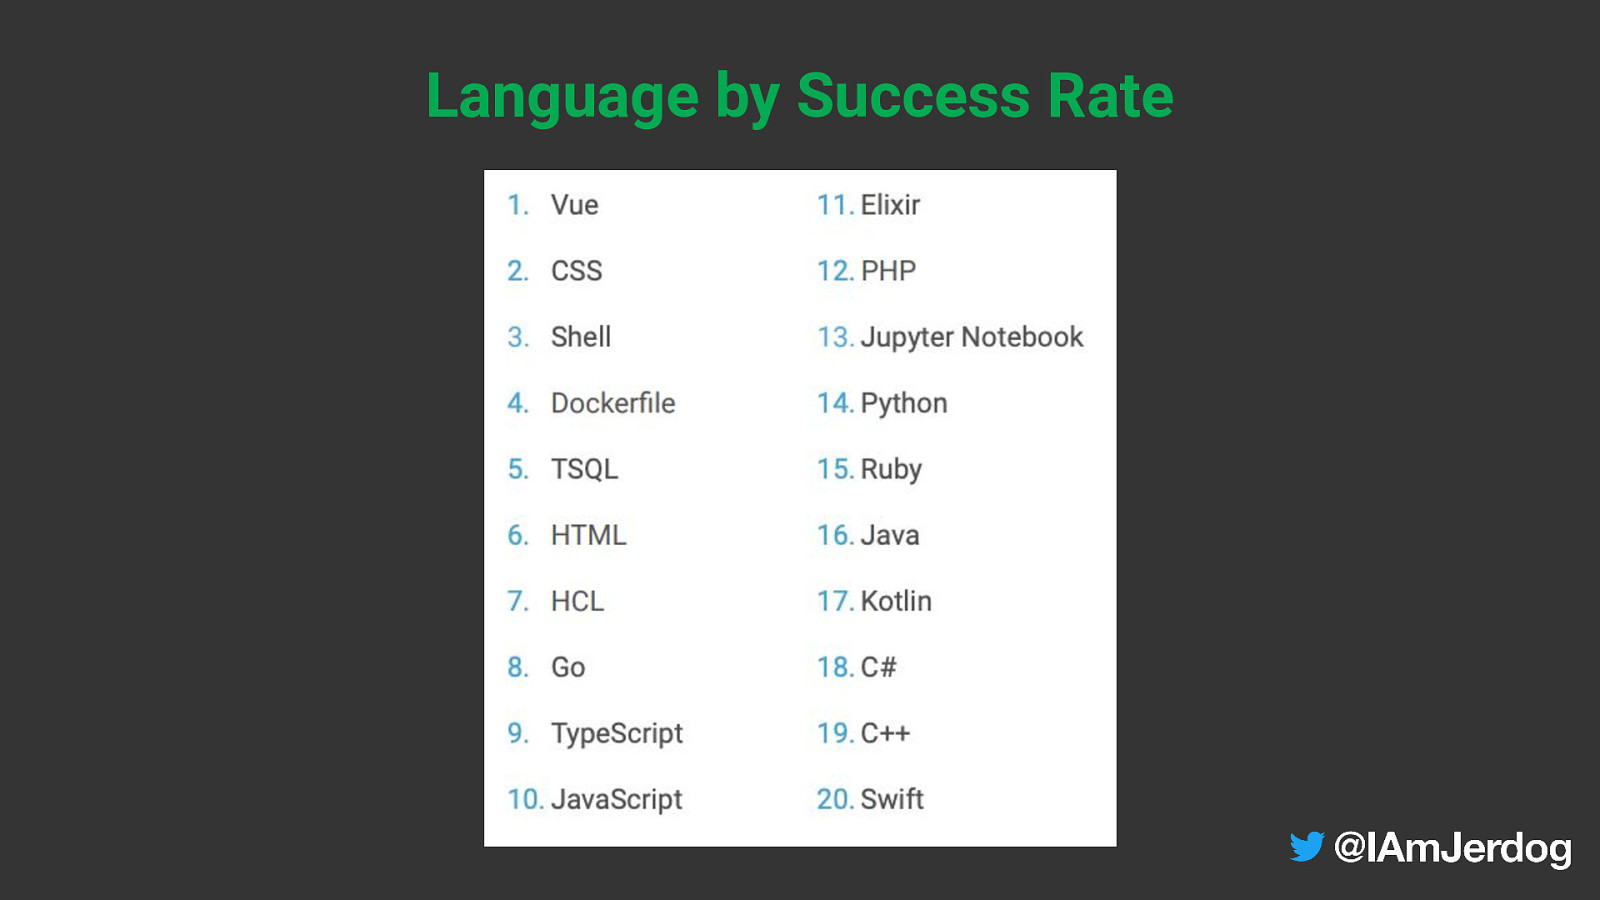
Language by Success Rate
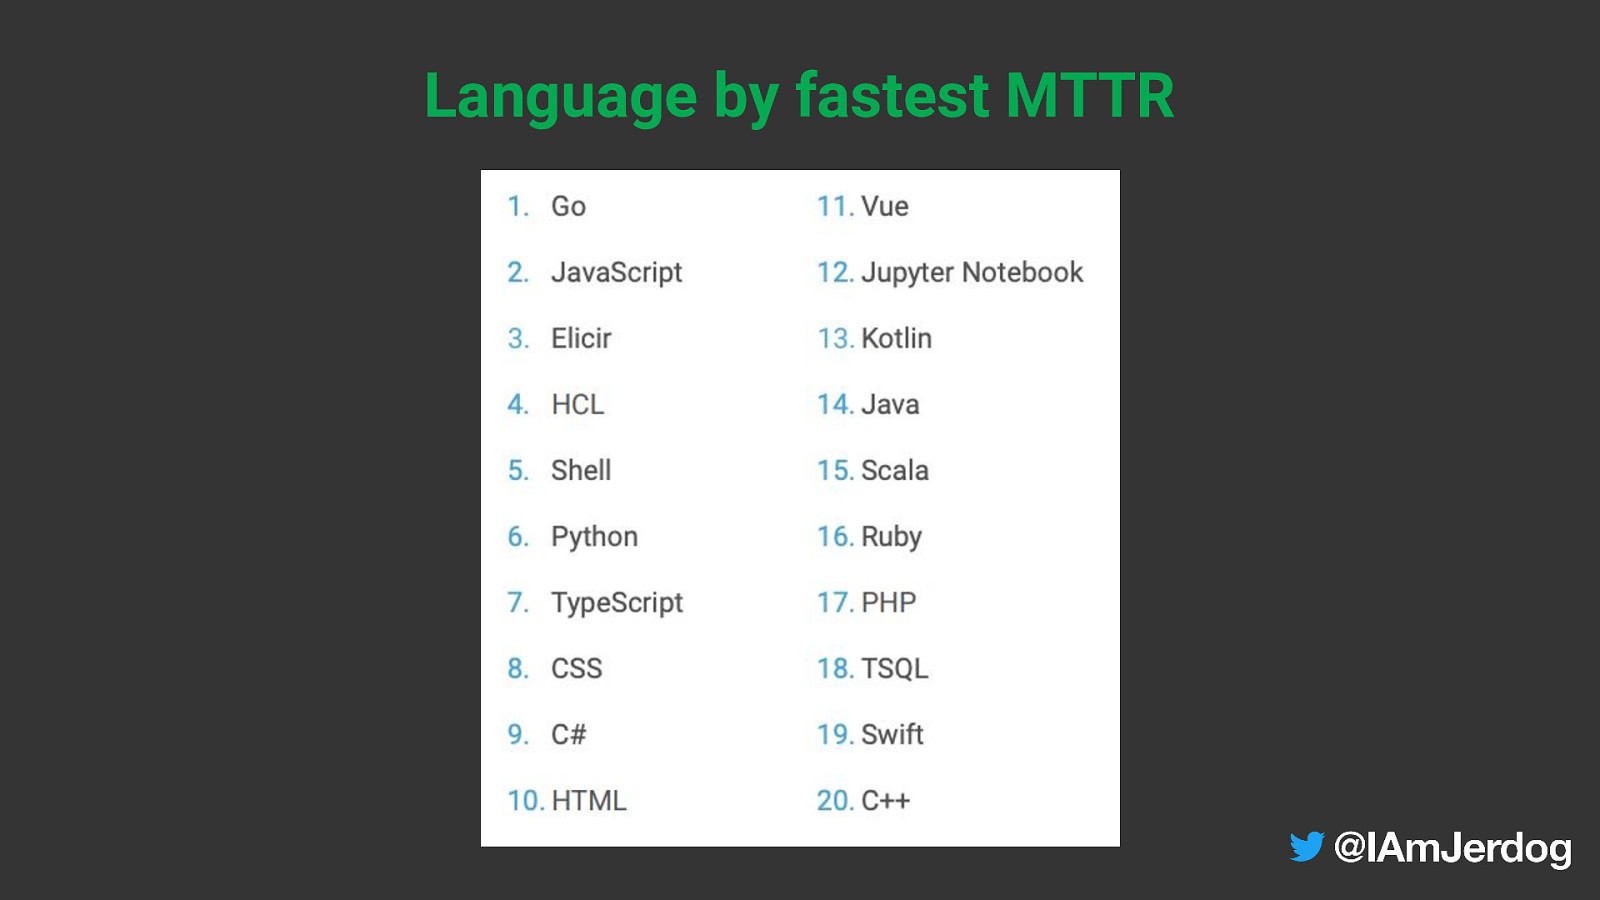
Language by fastest MTTR
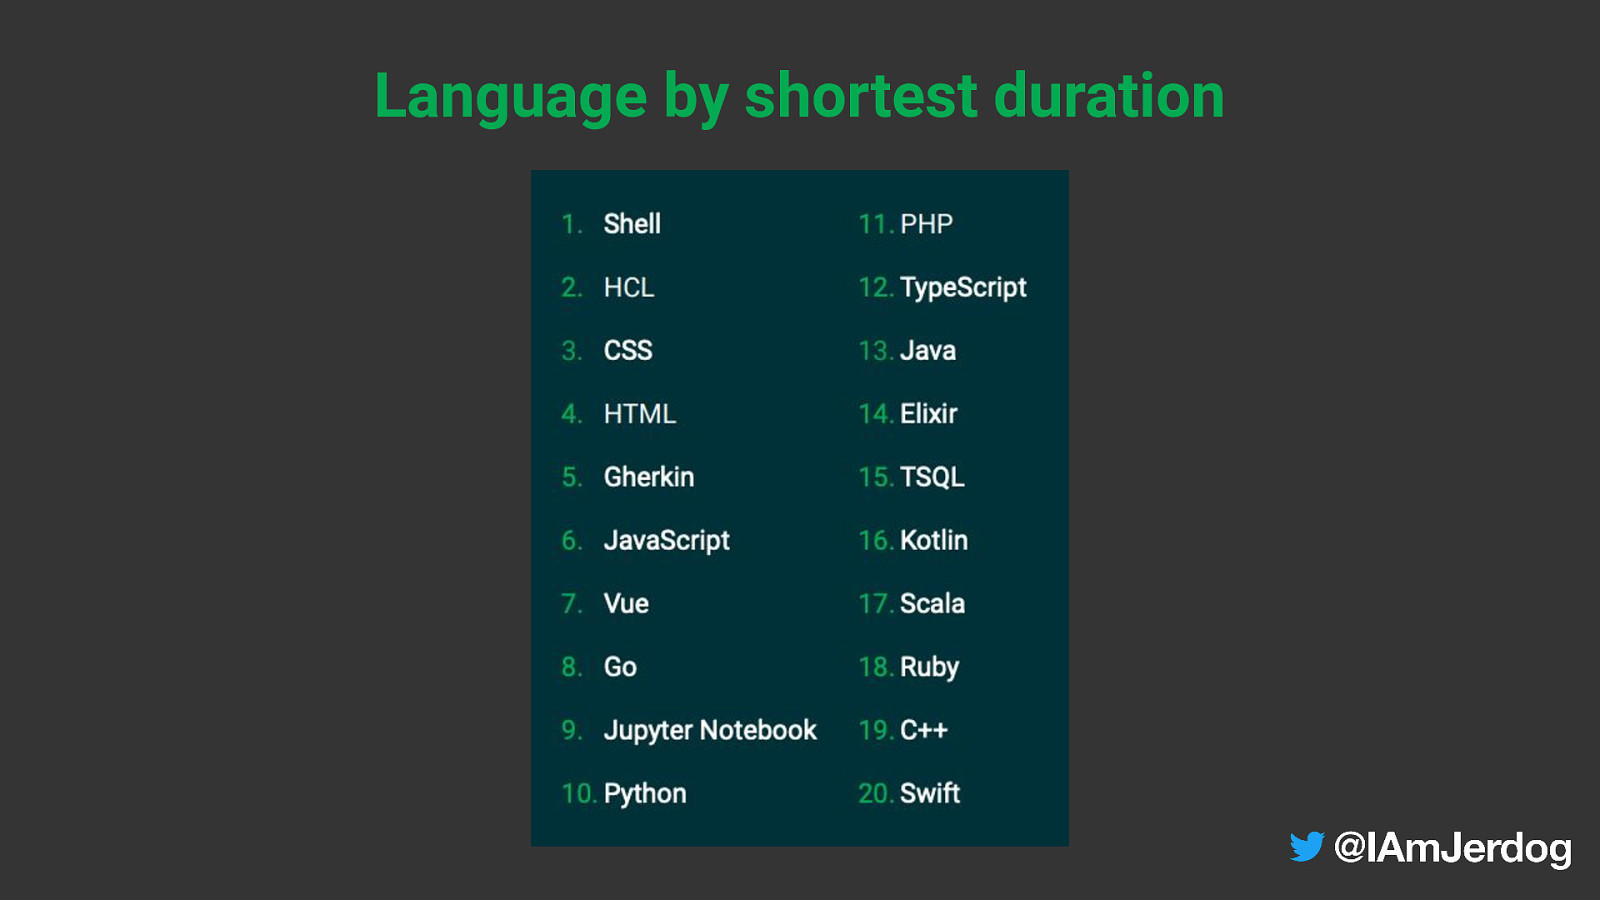
Language by shortest duration

“Don’t deploy on Friday” is not a thing.
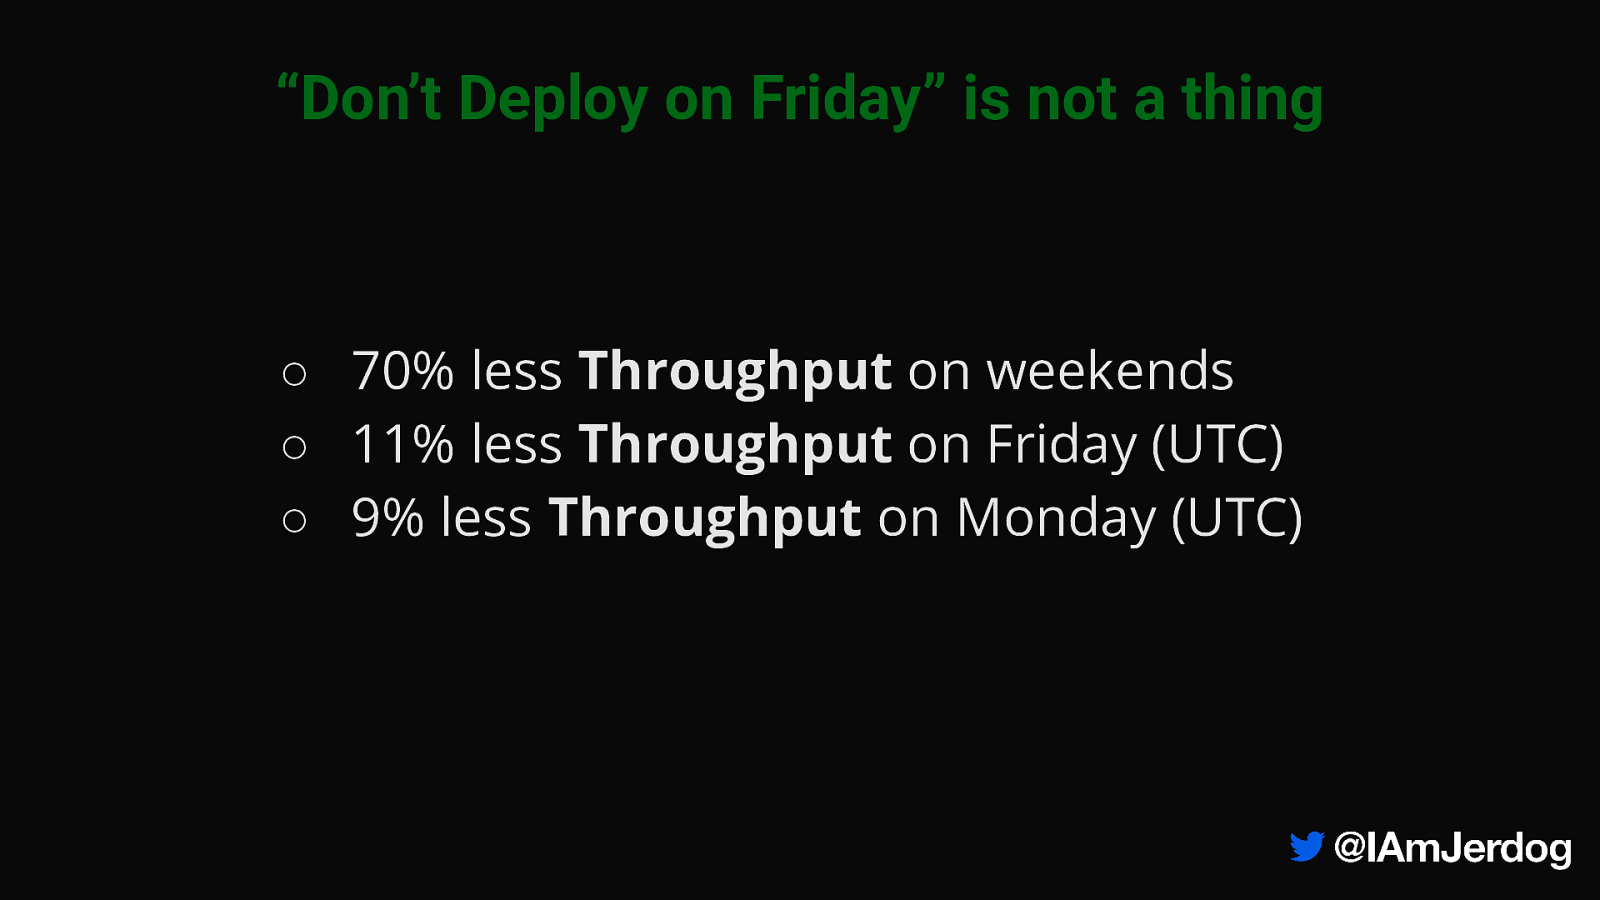
“Don’t Deploy on Friday” is not a thing ○ 70% less Throughput on weekends ○ 11% less Throughput on Friday (UTC) ○ 9% less Throughput on Monday (UTC)
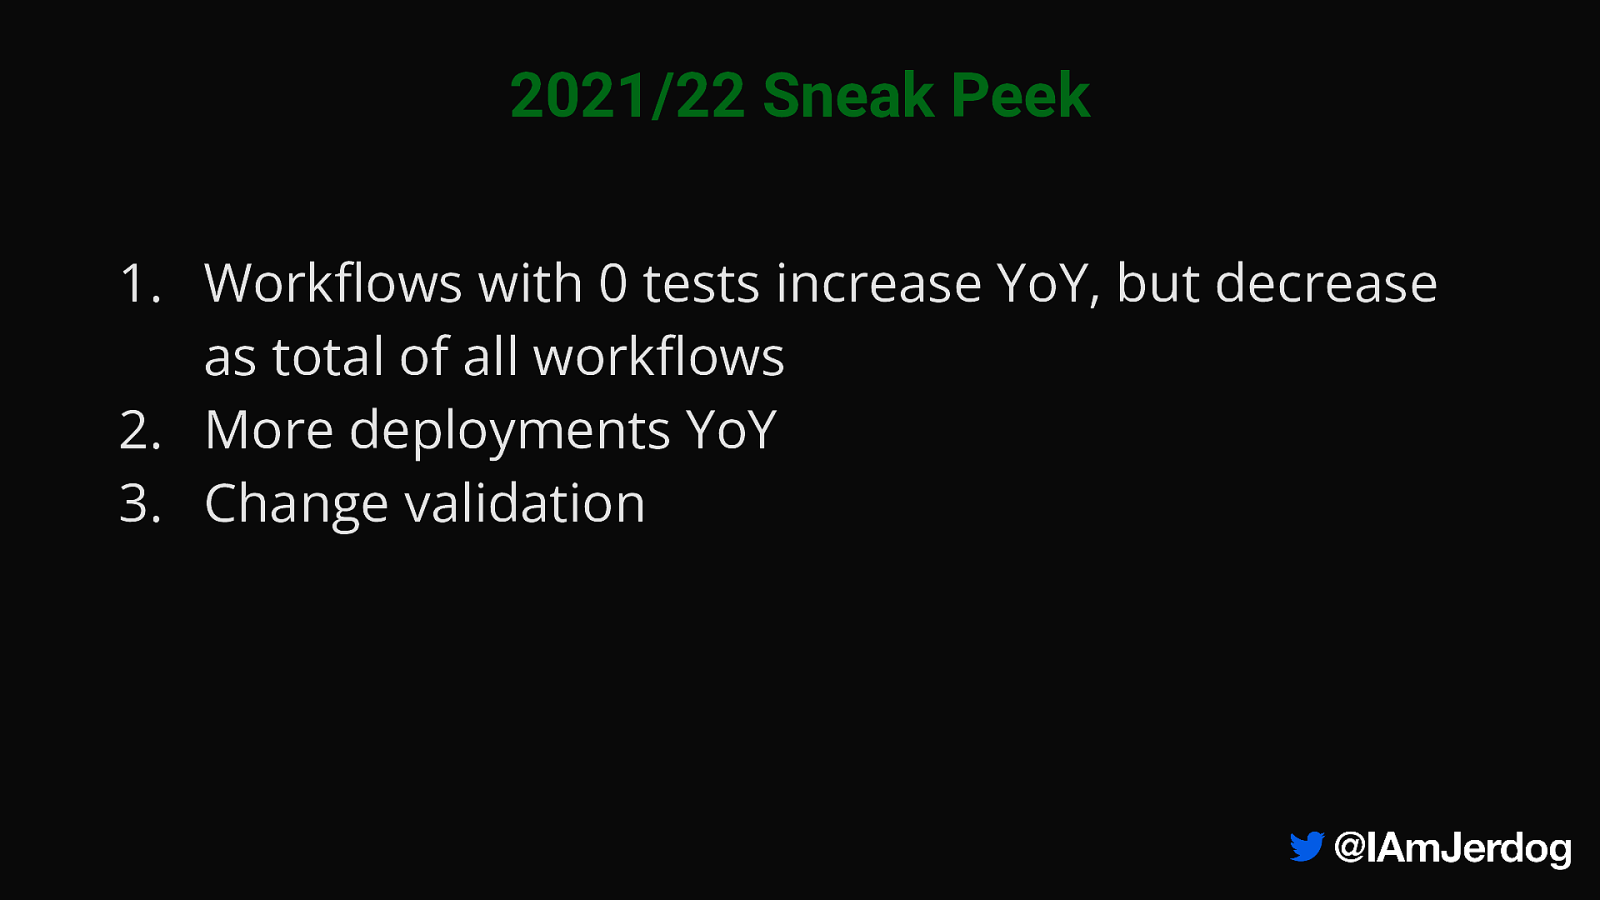
2021/22 Sneak Peek 1. Workflows with 0 tests increase YoY, but decrease as total of all workflows 2. More deployments YoY 3. Change validation
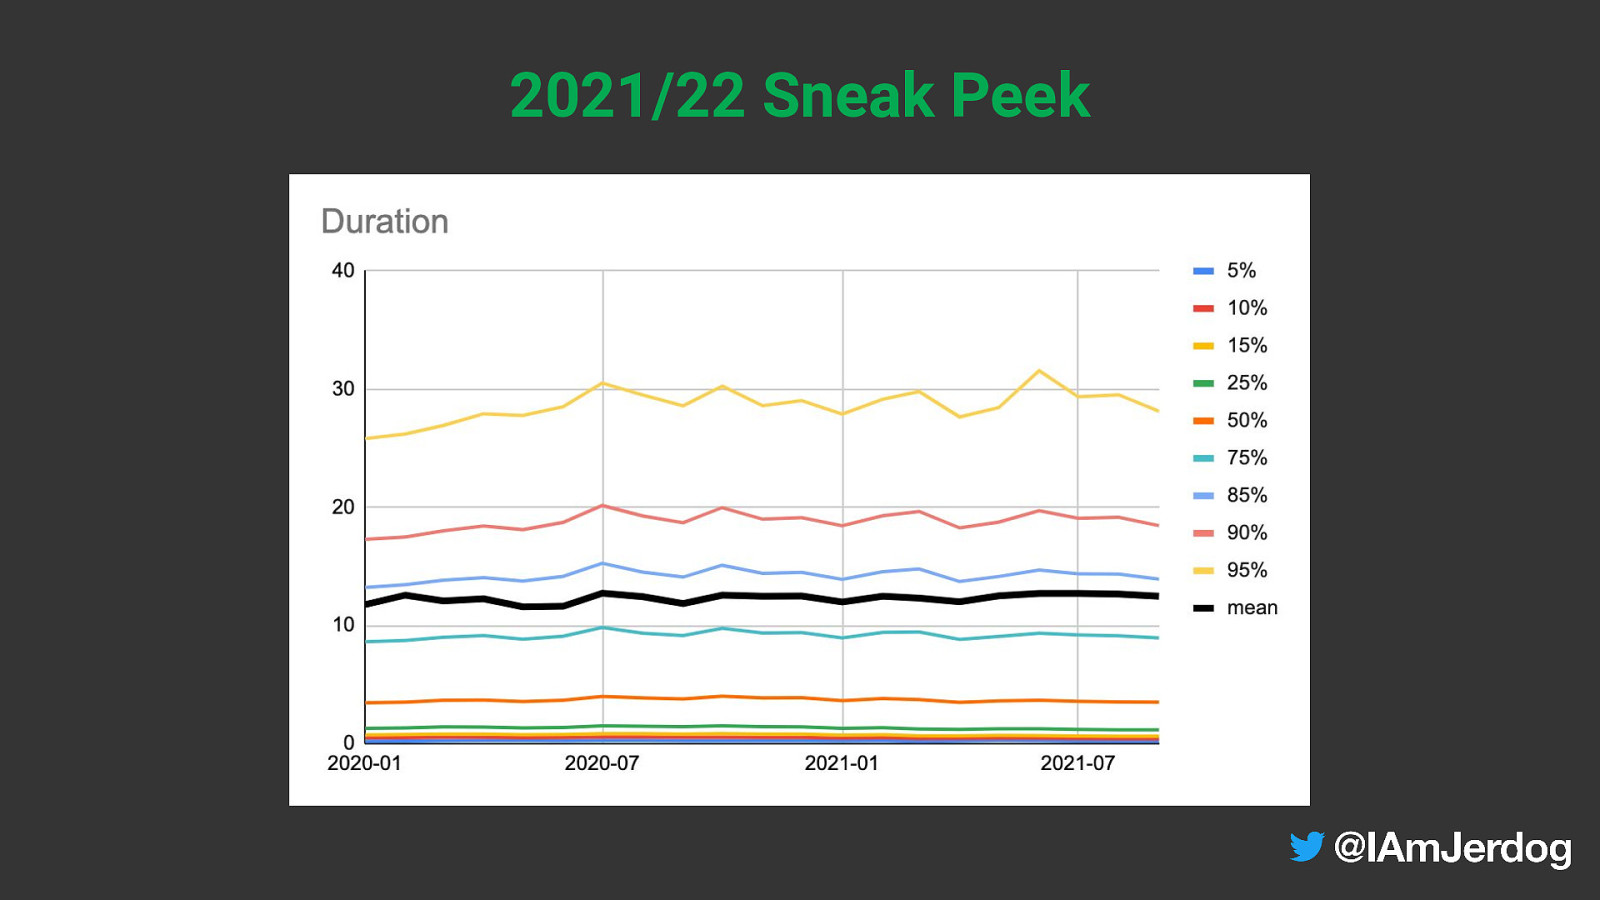
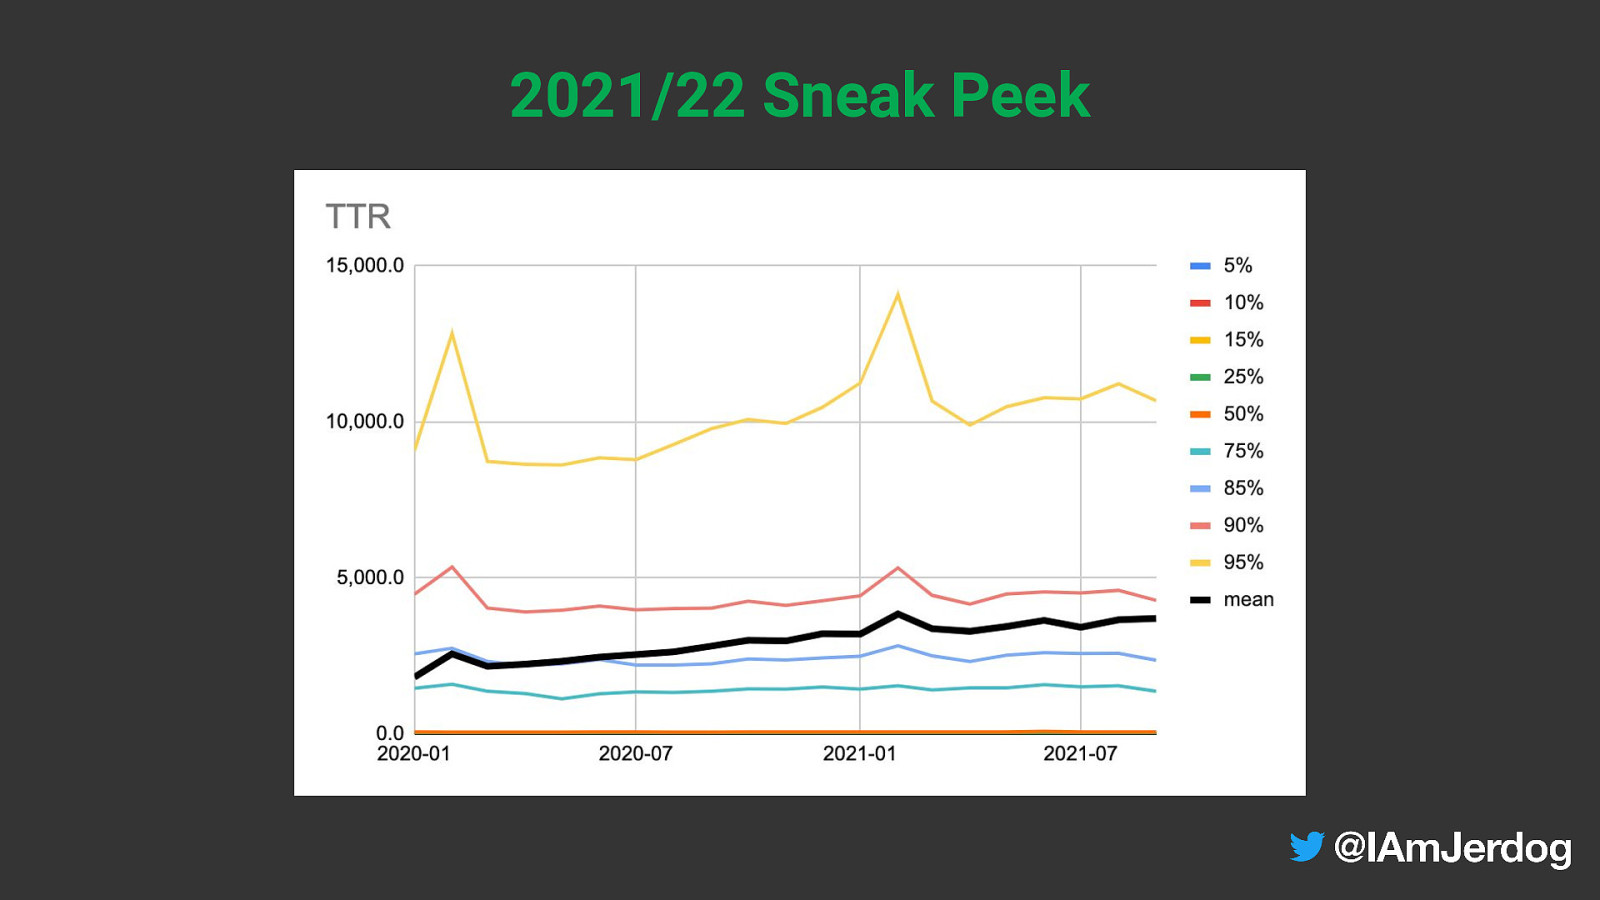
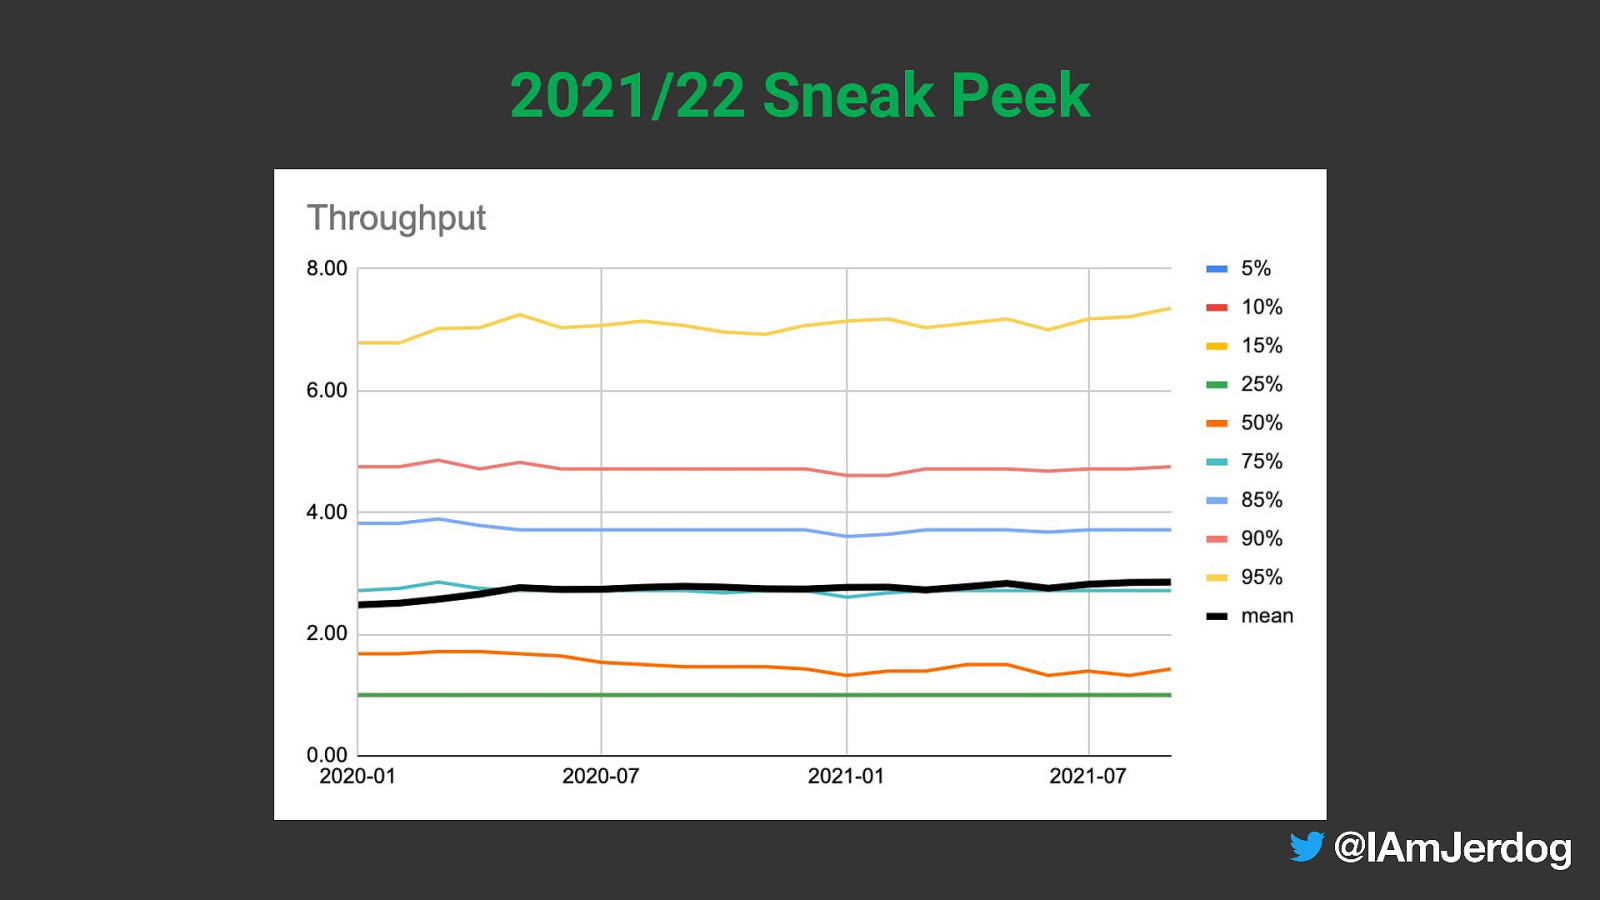
2021/22 Sneak Peek
2021/22 Sneak Peek
2021/22 Sneak Peek
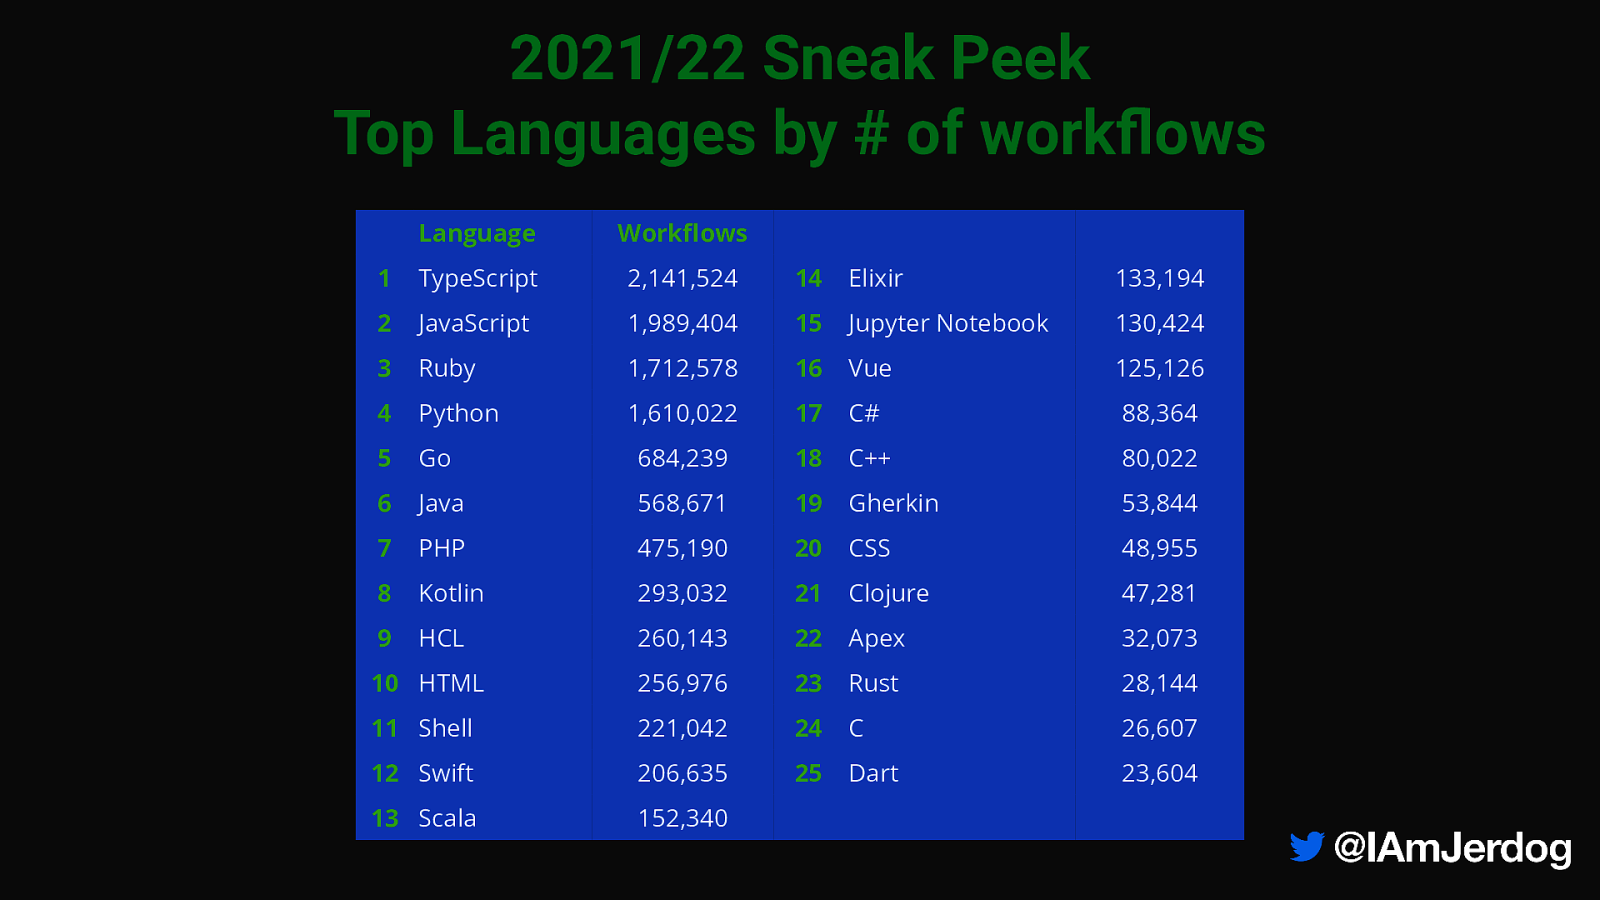
2021/22 Sneak Peek Top Languages by # of workflows Language Workflows 1 TypeScript 2,141,524 14 Elixir 133,194 2 JavaScript 1,989,404 15 Jupyter Notebook 130,424 3 Ruby 1,712,578 16 Vue 125,126 4 Python 1,610,022 17 C# 88,364 5 Go 684,239 18 C++ 80,022 6 Java 568,671 19 Gherkin 53,844 7 PHP 475,190 20 CSS 48,955 8 Kotlin 293,032 21 Clojure 47,281 9 HCL 260,143 22 Apex 32,073 10 HTML 256,976 23 Rust 28,144 11 Shell 221,042 24 C 26,607 12 Swift 206,635 25 Dart 23,604 13 Scala 152,340
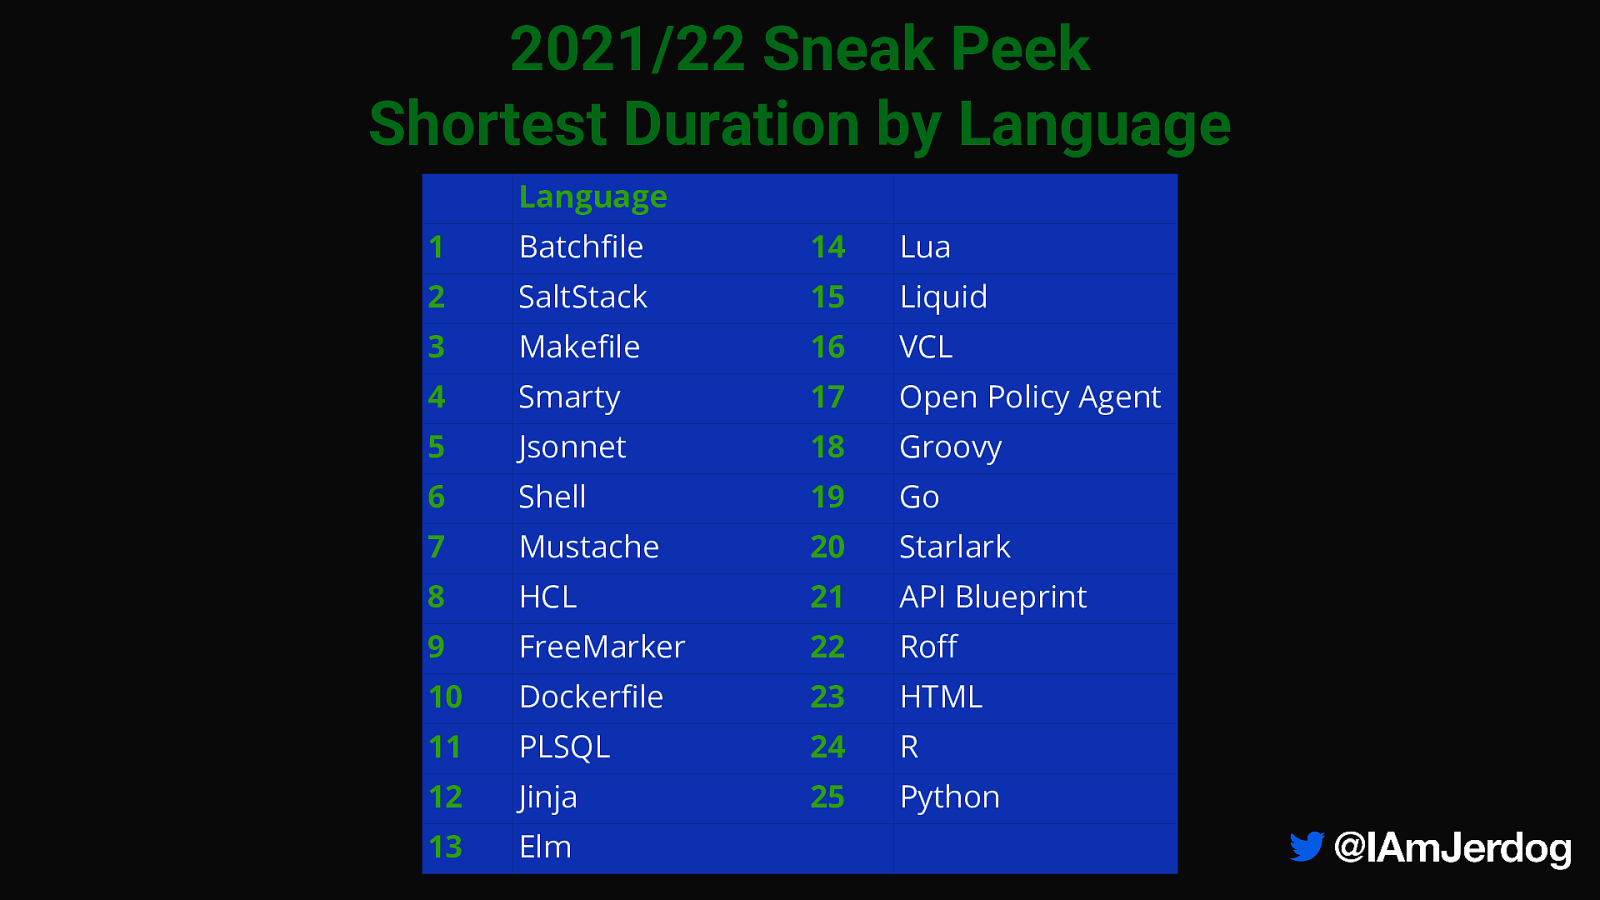
2021/22 Sneak Peek Shortest Duration by Language Language 1 Batchfile 14 Lua 2 SaltStack 15 Liquid 3 Makefile 16 VCL 4 Smarty 17 Open Policy Agent 5 Jsonnet 18 Groovy 6 Shell 19 Go 7 Mustache 20 Starlark 8 HCL 21 API Blueprint 9 FreeMarker 22 Roff 10 Dockerfile 23 HTML 11 PLSQL 24 R 12 Jinja 25 Python 13 Elm
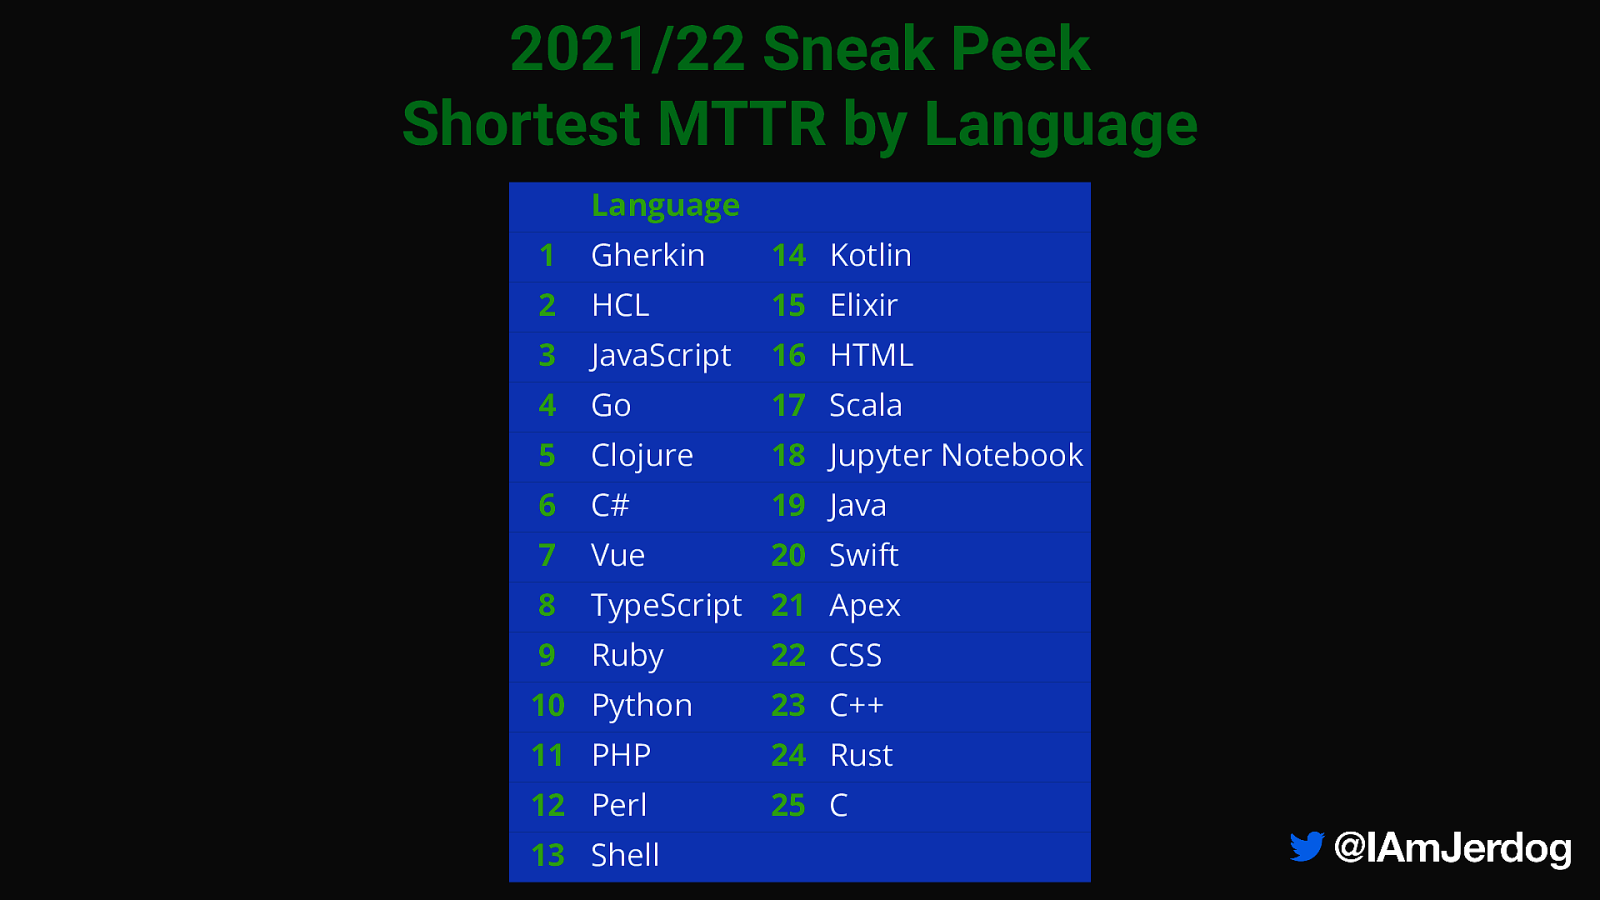
2021/22 Sneak Peek Shortest MTTR by Language Language 1 Gherkin 14 Kotlin 2 HCL 15 Elixir 3 JavaScript 16 HTML 4 Go 17 Scala 5 Clojure 18 Jupyter Notebook 6 C# 19 Java 7 Vue 20 Swift 8 TypeScript 21 Apex 9 Ruby 22 CSS 10 Python 23 C++ 11 PHP 24 Rust 12 Perl 25 C 13 Shell
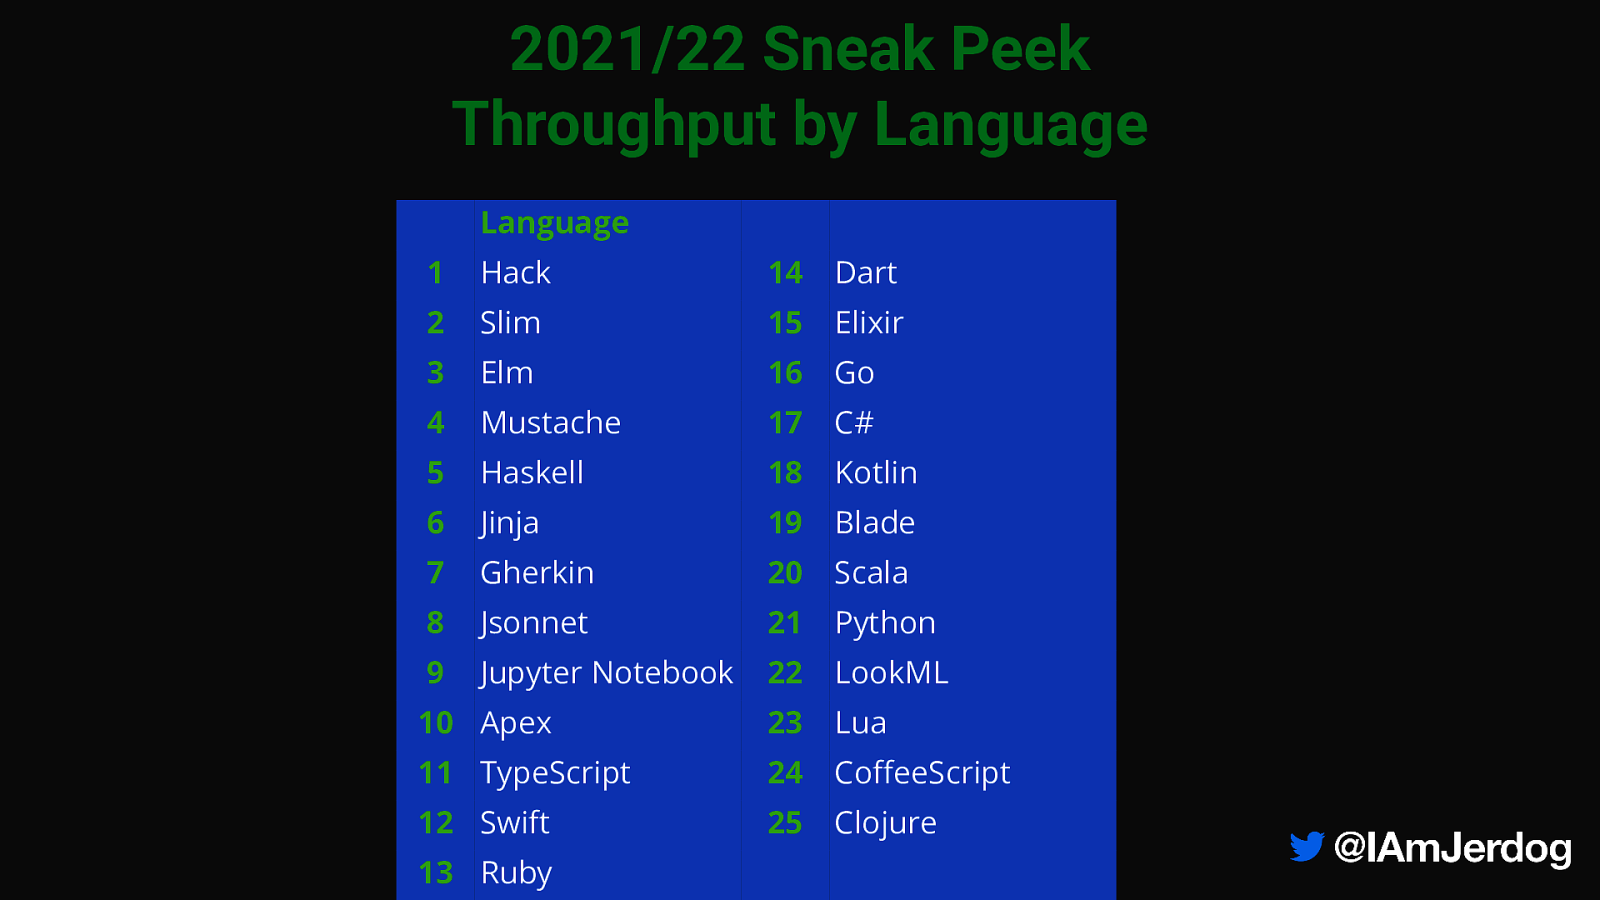
2021/22 Sneak Peek Throughput by Language Language 1 Hack 14 Dart 2 Slim 15 Elixir 3 Elm 16 Go 4 Mustache 17 C# 5 Haskell 18 Kotlin 6 Jinja 19 Blade 7 Gherkin 20 Scala 8 Jsonnet 21 Python 9 Jupyter Notebook 22 LookML 10 Apex 23 Lua 11 TypeScript 24 CoffeeScript 12 Swift 25 Clojure 13 Ruby
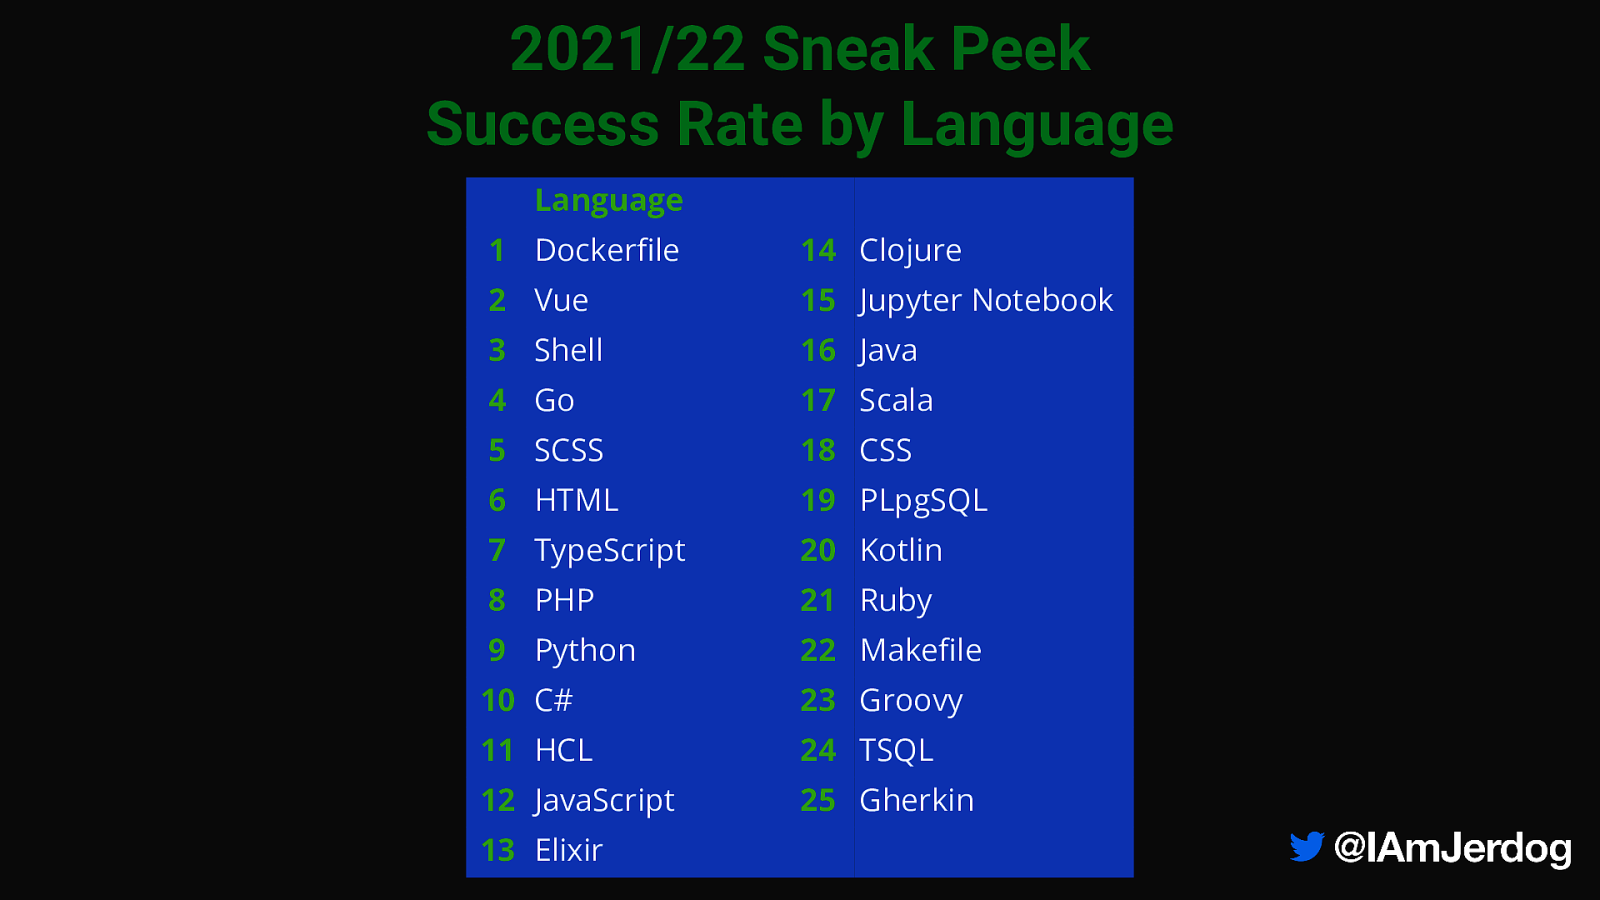
2021/22 Sneak Peek Success Rate by Language Language 1 Dockerfile 14 Clojure 2 Vue 15 Jupyter Notebook 3 Shell 16 Java 4 Go 17 Scala 5 SCSS 18 CSS 6 HTML 19 PLpgSQL 7 TypeScript 20 Kotlin 8 PHP 21 Ruby 9 Python 22 Makefile 10 C# 23 Groovy 11 HCL 24 TSQL 12 JavaScript 25 Gherkin 13 Elixir
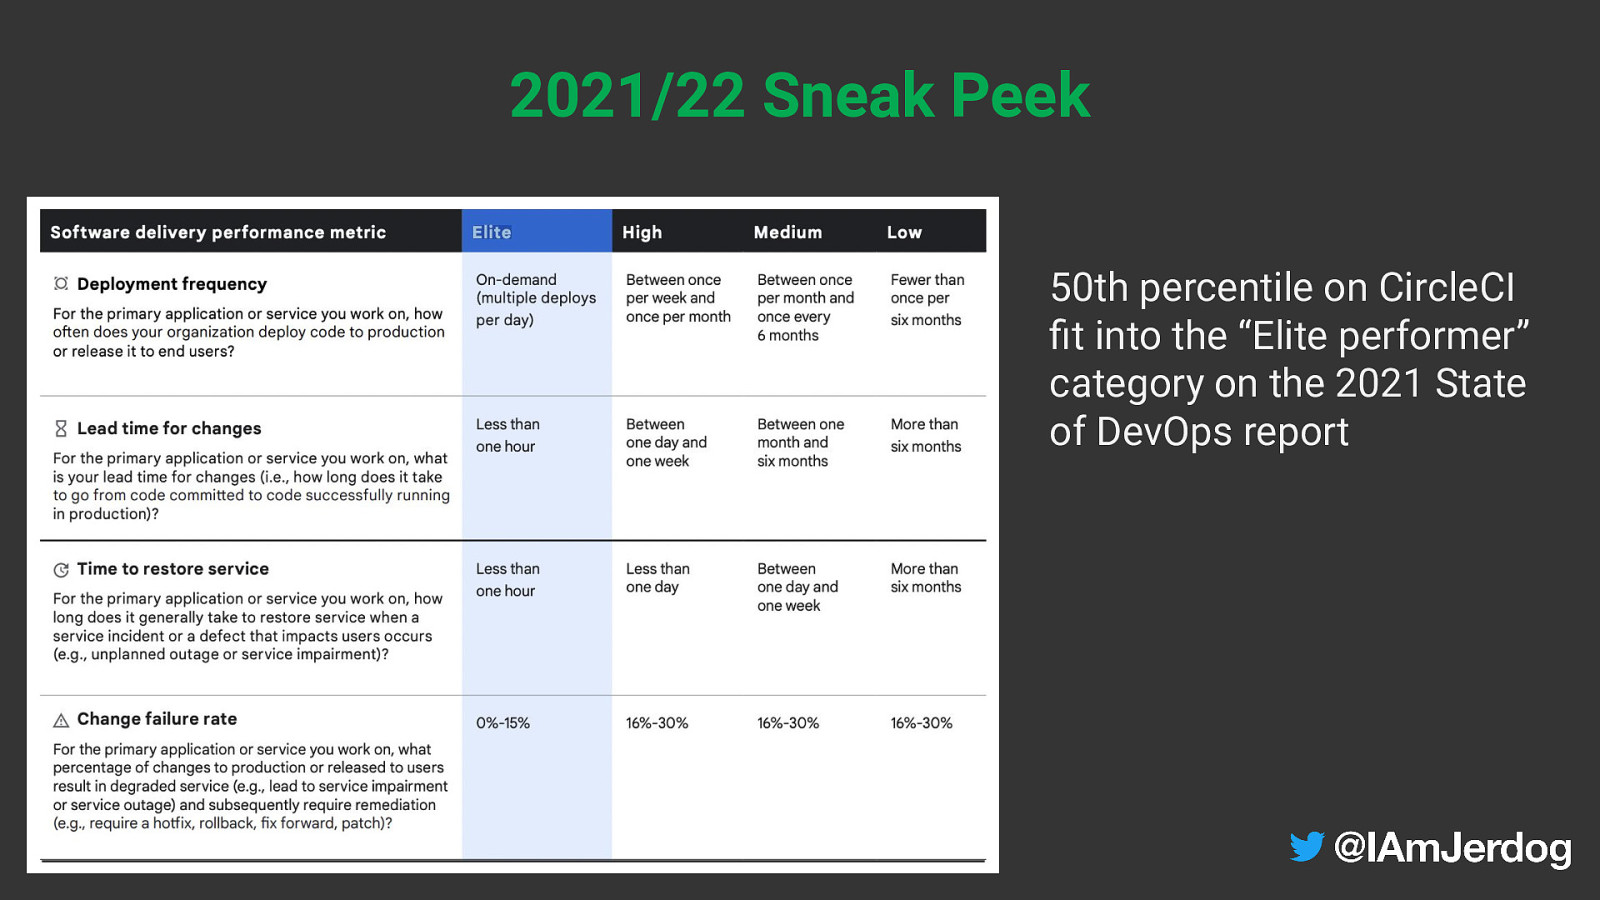
2021/22 Sneak Peek 50th percentile on CircleCI fit into the “Elite performer” category on the 2021 State of DevOps report

Full Report https://circle.ci/ssd2020
Timeline.jerdog.me Thank you. For feedback and swag: circle.ci/jeremy IAmJerdog jerdog /in/jeremymeiss

In early 2020 a global pandemic set in motion events which none of us could predict. With anonymous data collected from 900k+ devs, 43K+ orgs, and 30m+ builds/mo we found some interesting insights into better DevOps practices. Since then, we’ve seen even more interesting activities happen, which shed new light on high-performing engineering teams. In this session, we will seek to uncover what this unique dataset can tell us about high-performing engineering teams, and what trends stand out through the aggregated platform usage.