Learnings on Better Software Delivery Principles Through a Panini
Slide 1

Slide 2

Pixabay via athree23 2
Slide 3
3
Slide 4
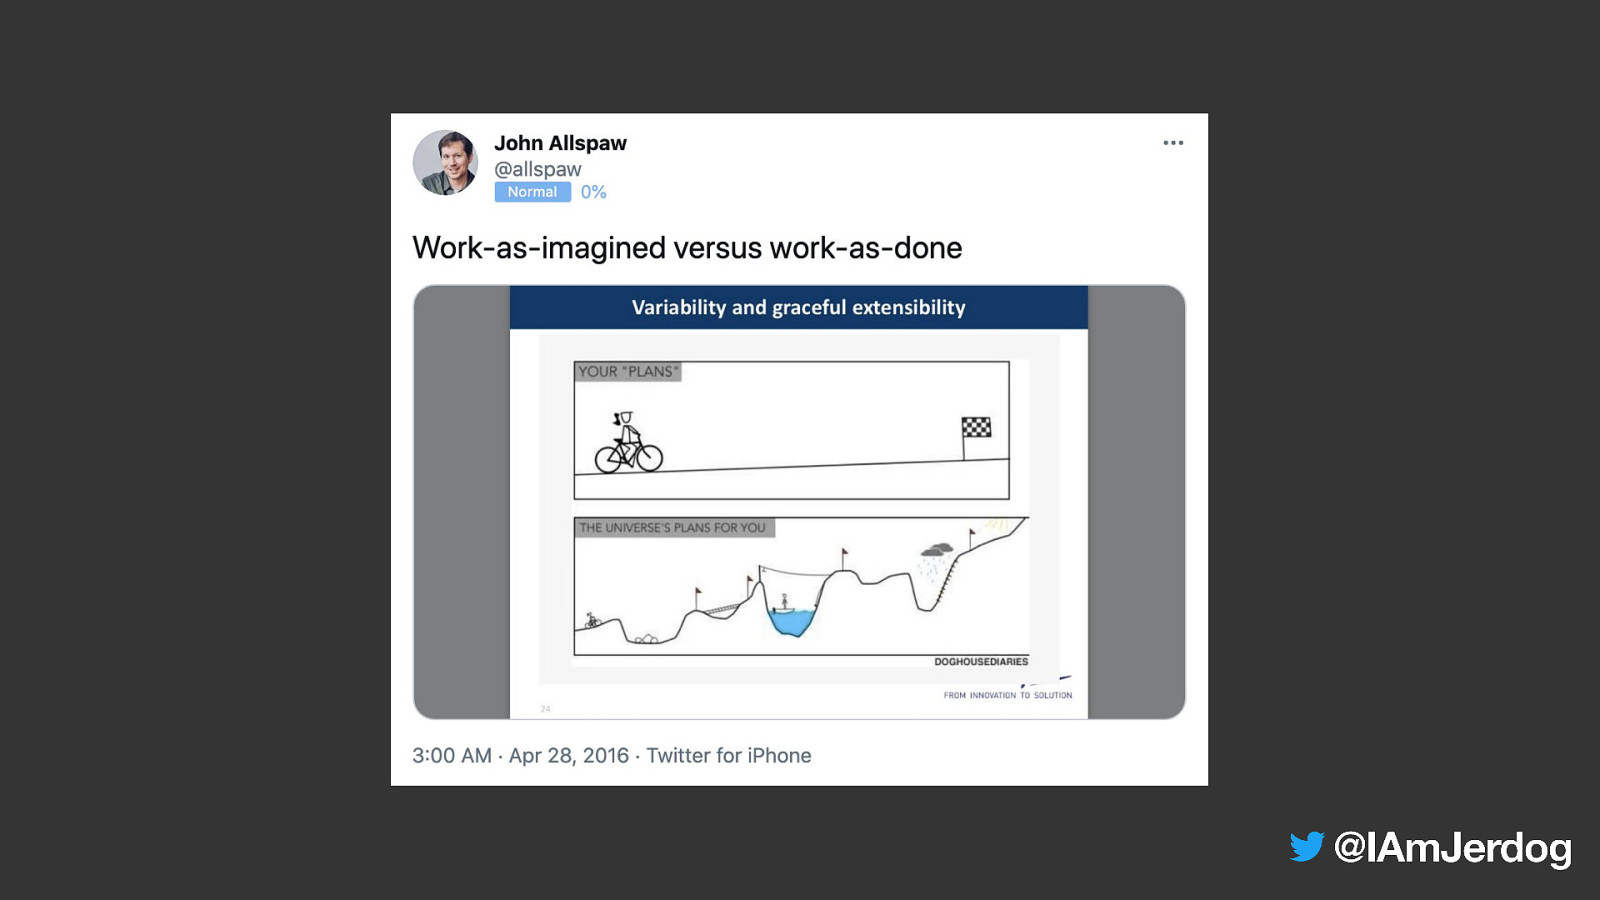
“
Slide 5
performance described vs performance derived
Slide 6

Jeremy Meiss Director, DevRel & Community
Slide 7
Slide 8
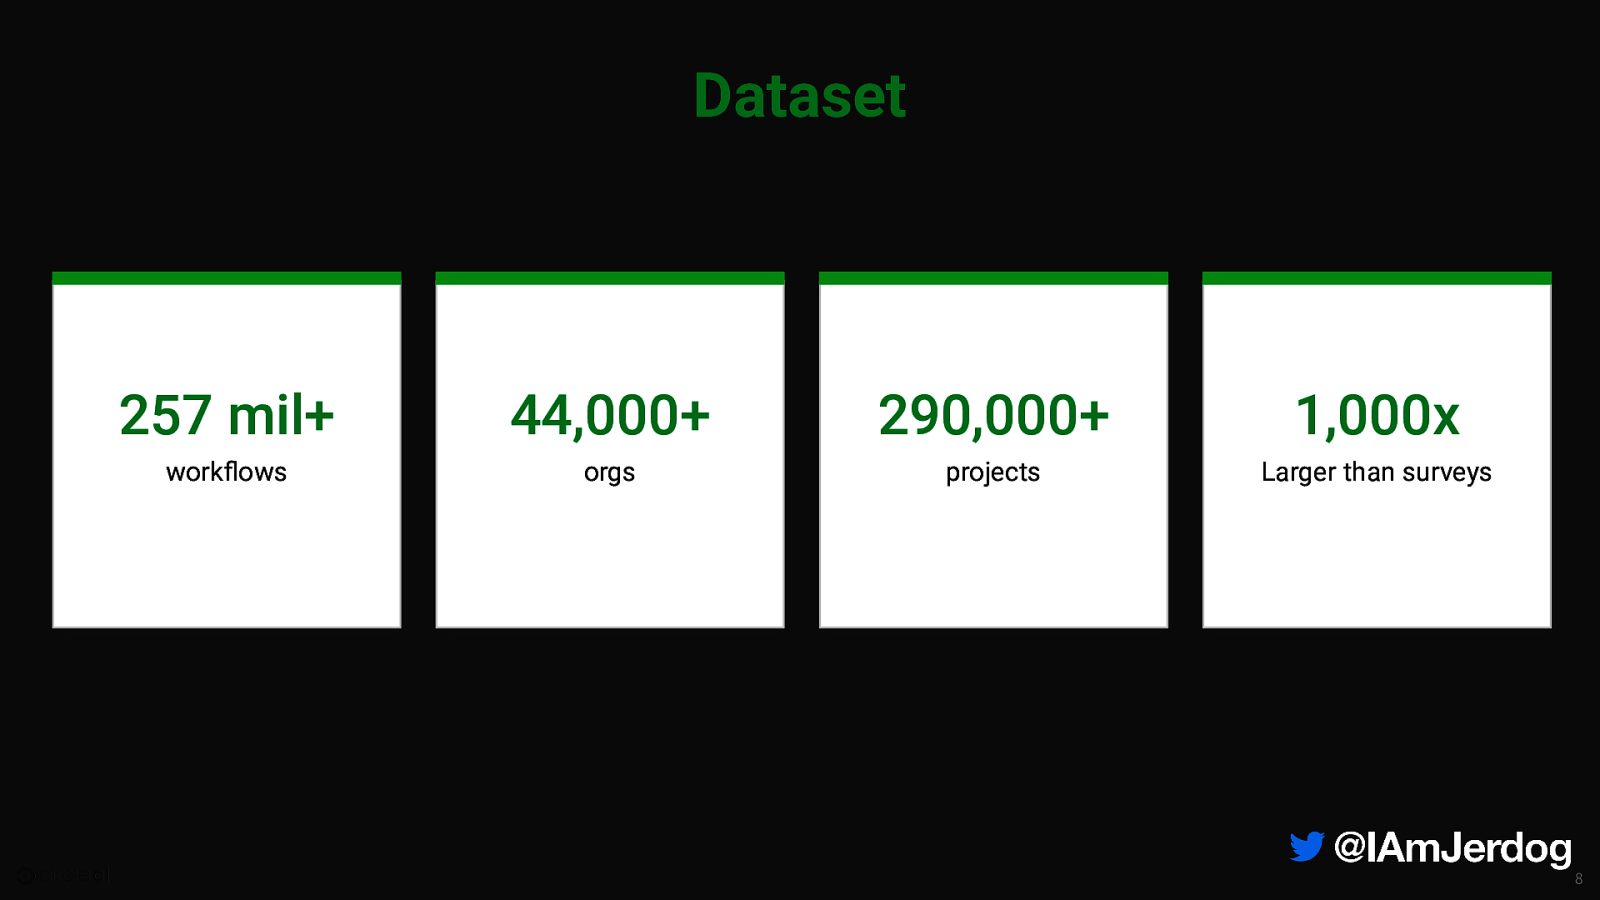
Dataset 257 mil+ 44,000+ 290,000+ 1,000x workflows orgs projects Larger than surveys 8
Slide 9
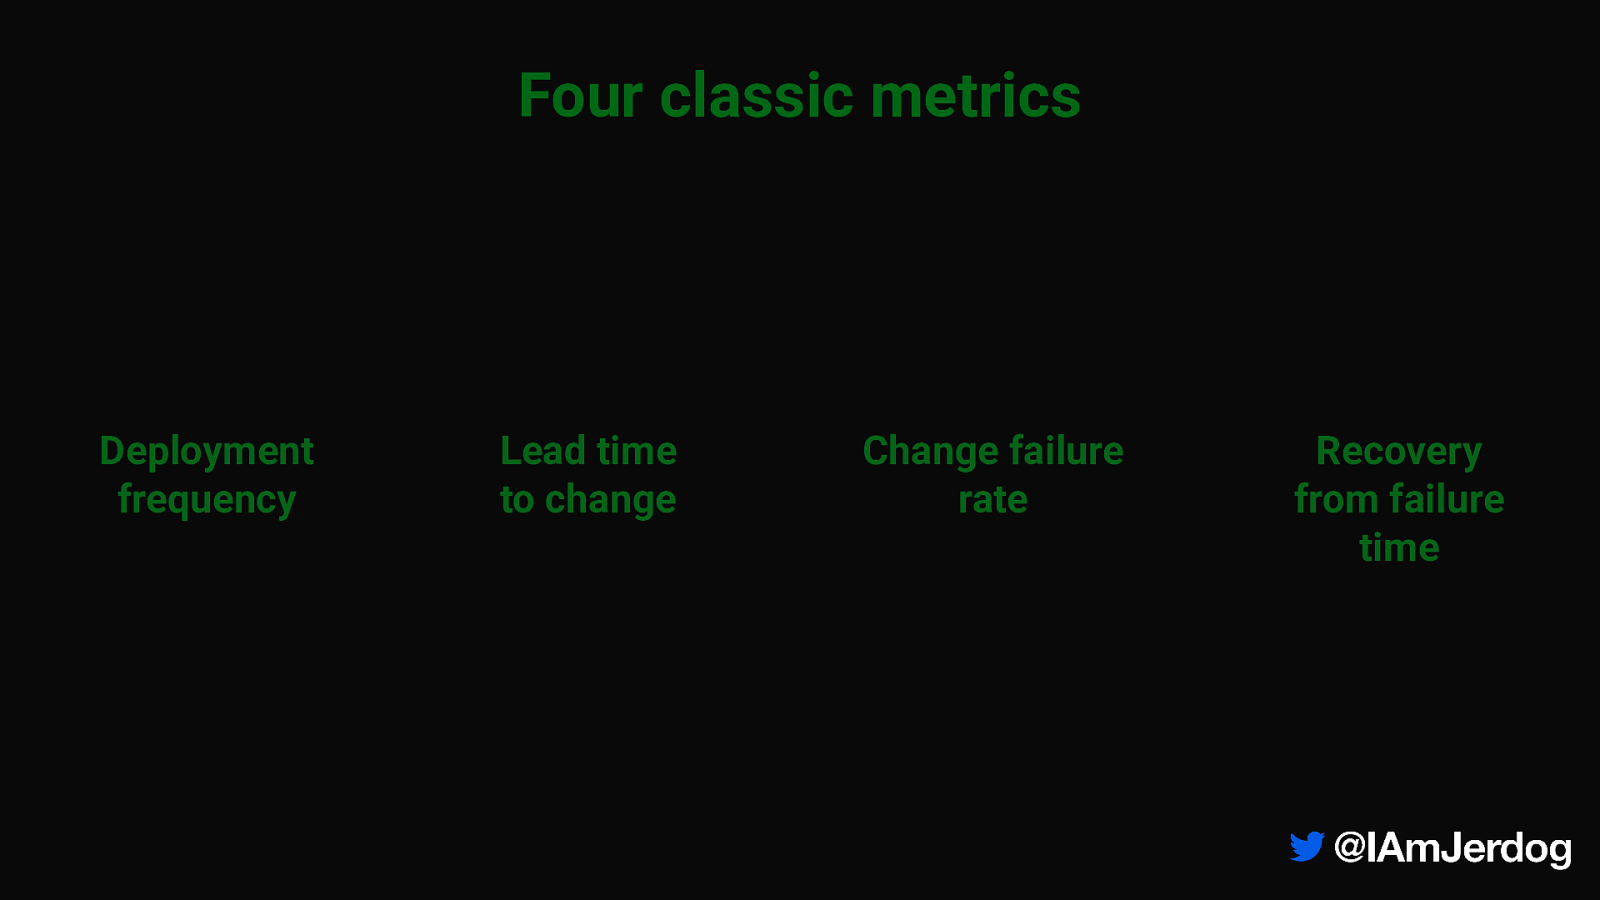
Four classic metrics Deployment frequency Lead time to change Change failure rate Recovery from failure time
Slide 10
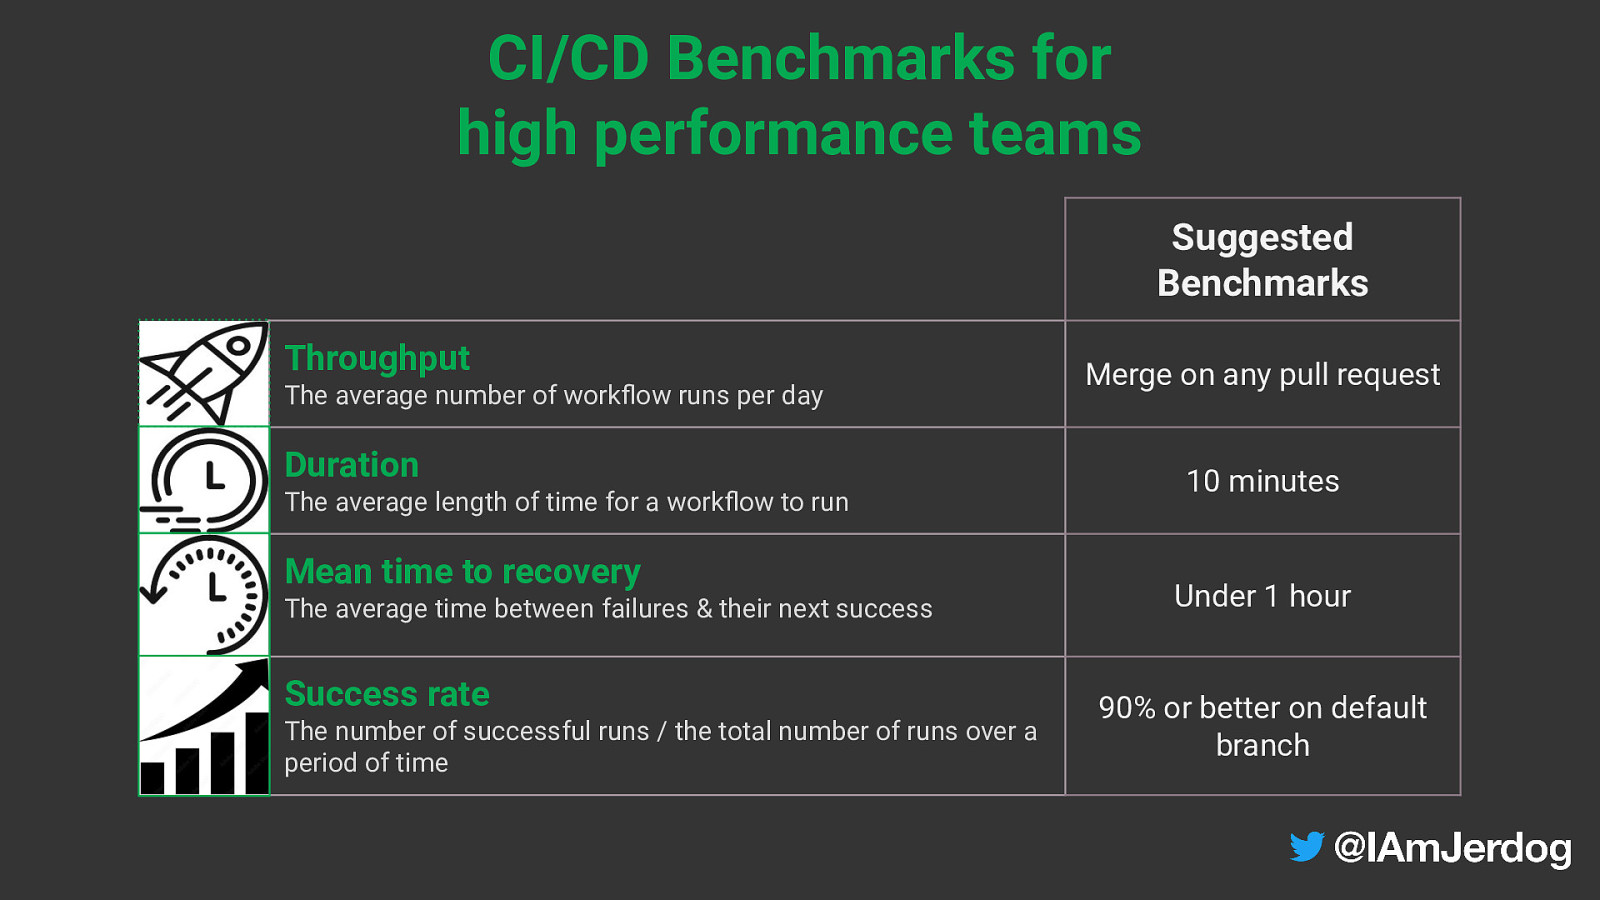
CI/CD Benchmarks for high performance teams Suggested Benchmarks Throughput The average number of workflow runs per day Duration The average length of time for a workflow to run Mean time to recovery The average time between failures & their next success Success rate The number of successful runs / the total number of runs over a period of time Merge on any pull request 10 minutes Under 1 hour 90% or better on default branch
Slide 11

11
Slide 12

The Data
Slide 13

Photo by: Matthew Henry 13
Slide 14

Throughput the average number of workflow runs per day 14
Slide 15
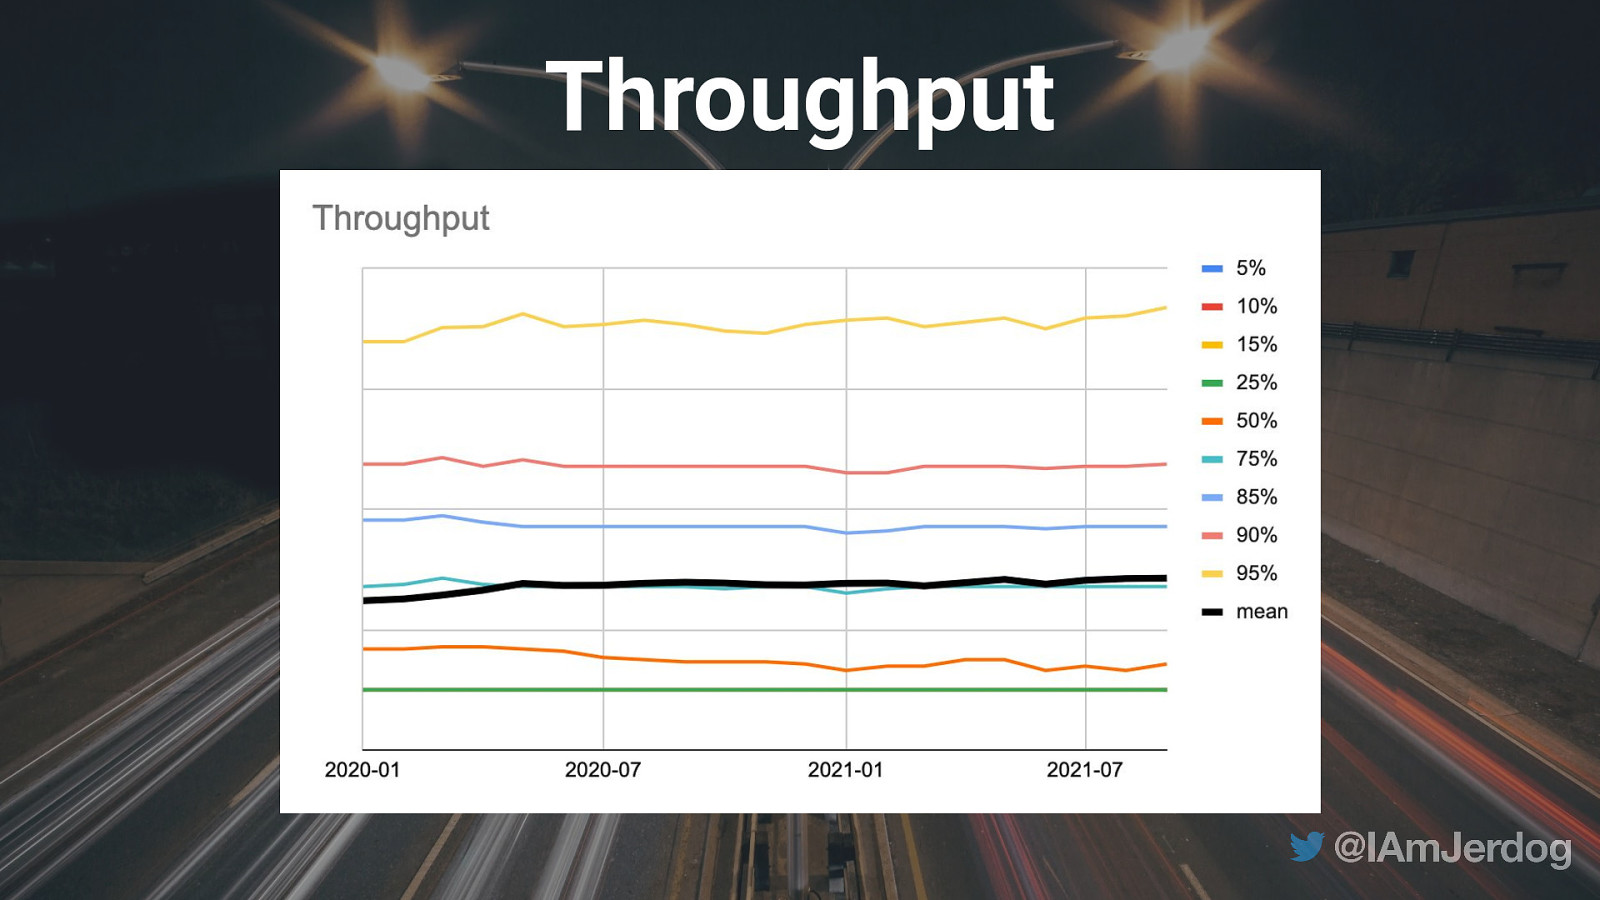
Throughput
Slide 16
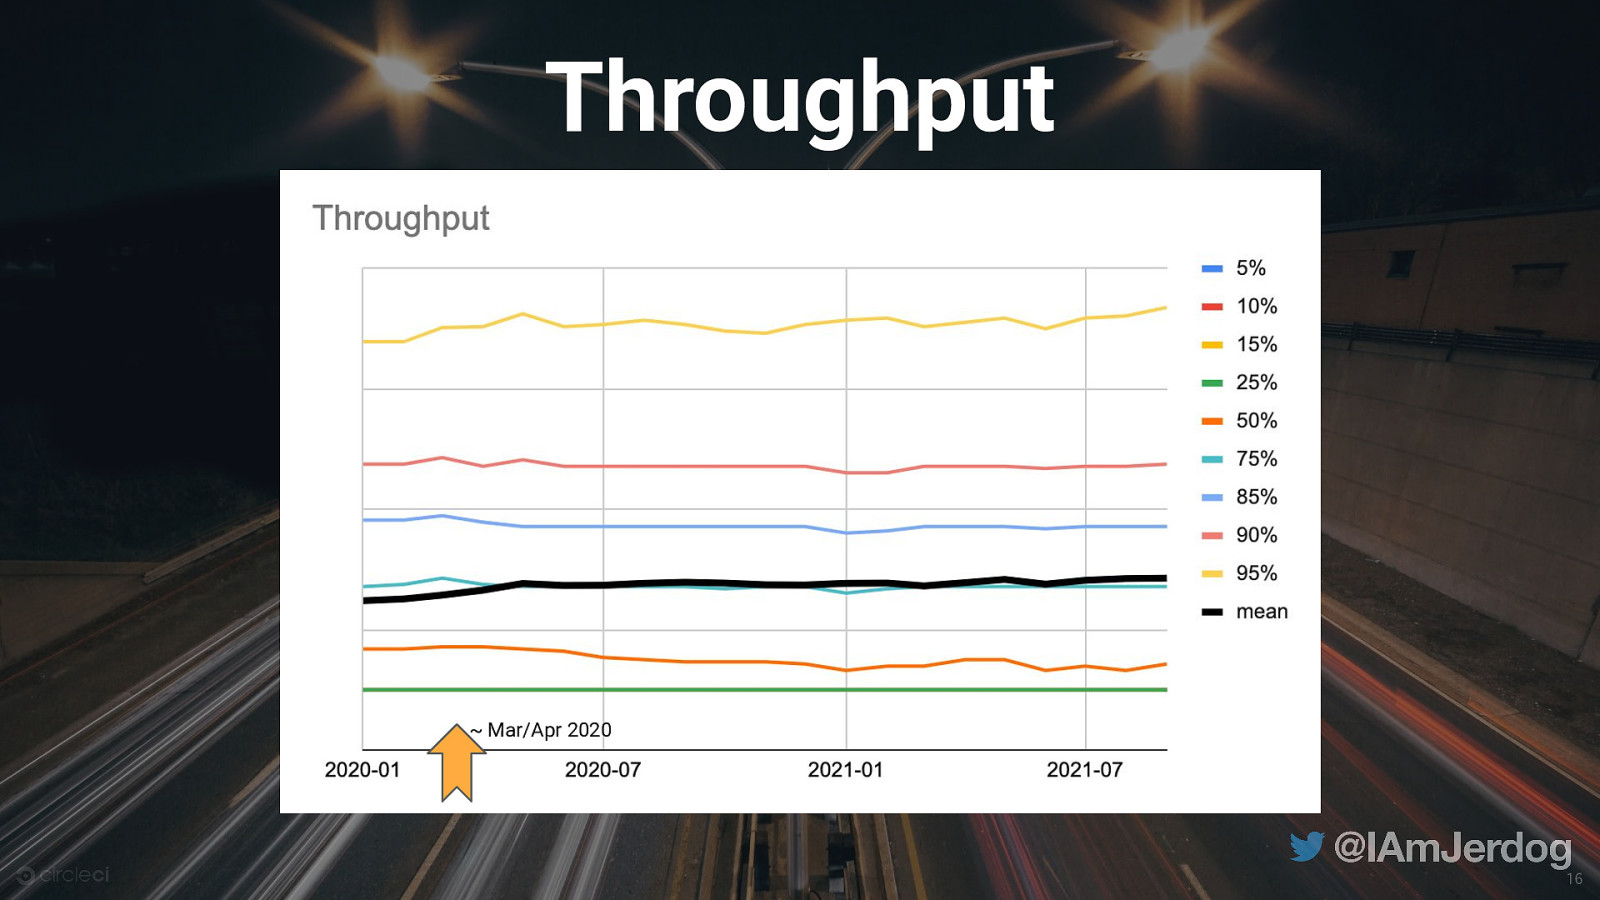
Throughput ~ Mar/Apr 2020 16
Slide 17
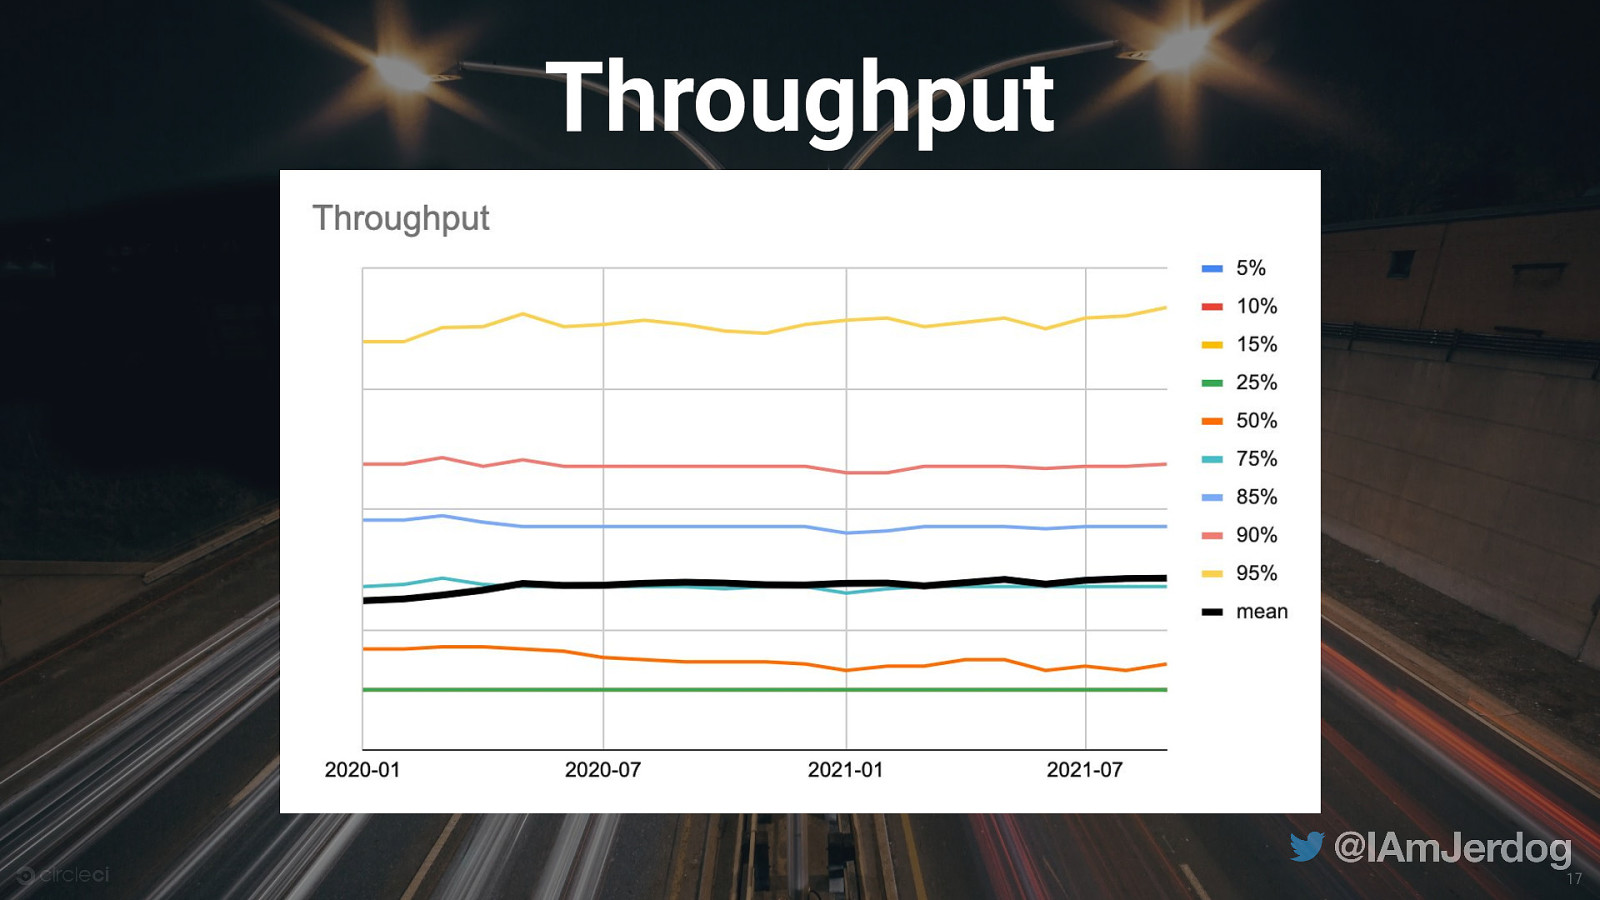
Throughput 17
Slide 18
Most teams are not deploying dozens of times per day
Slide 19

Goal: Continuous validation of your codebase via your pipeline
Slide 20

Image by Pawan Kolhe from Pixabay
Slide 21

Duration Image by Pawan Kolhe from Pixabay the length of time it takes for a workflow to run 21
Slide 22
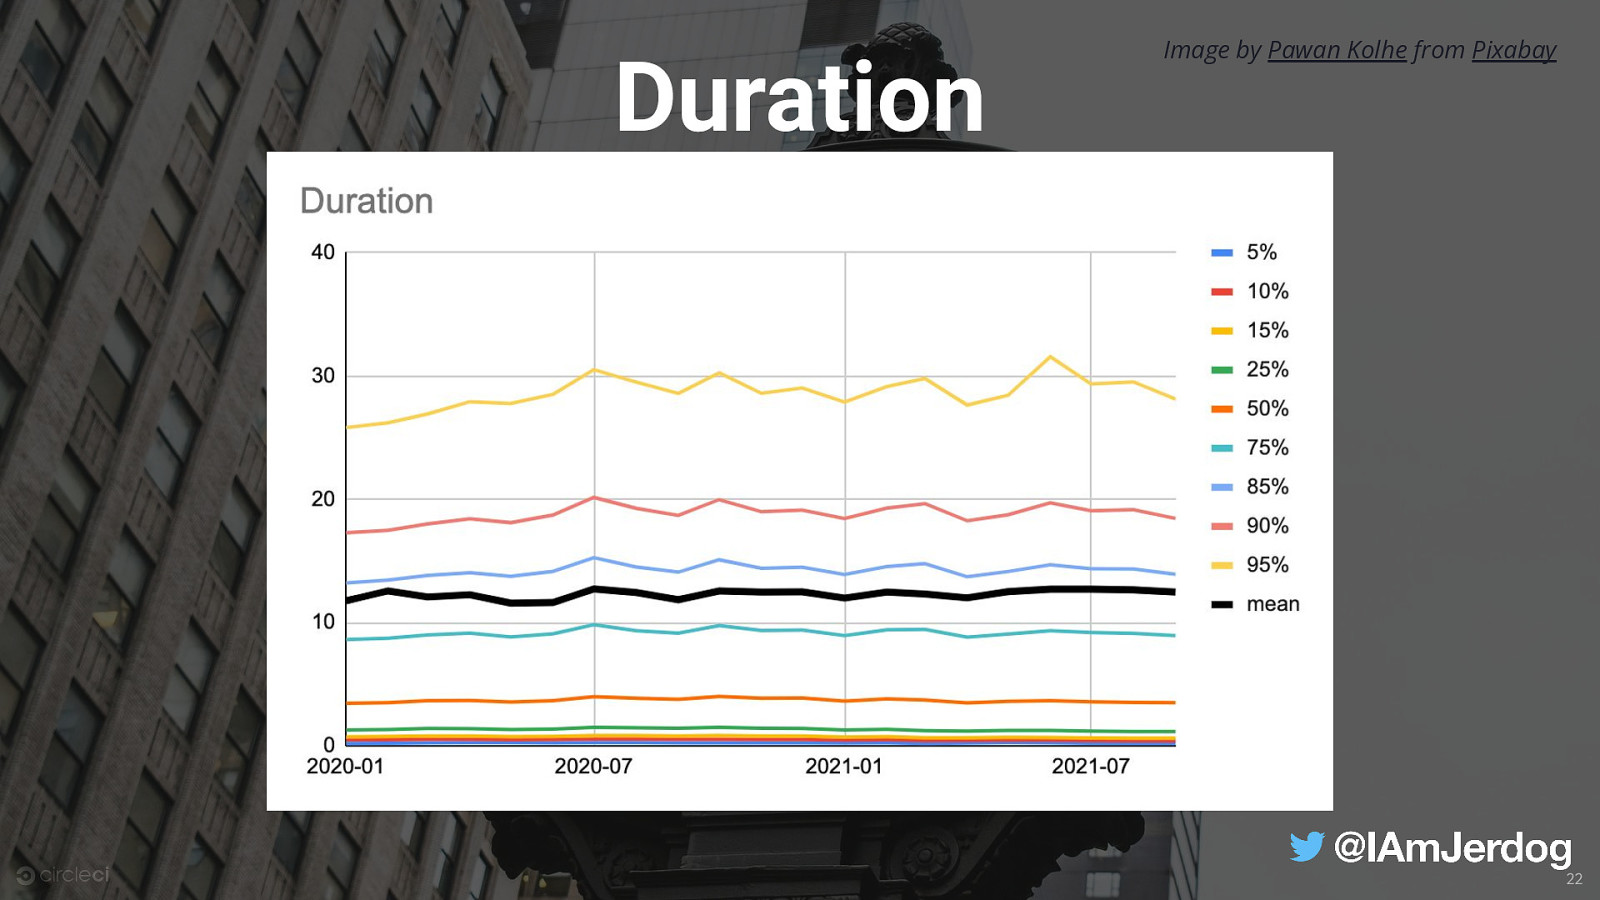
Duration Image by Pawan Kolhe from Pixabay 22
Slide 23
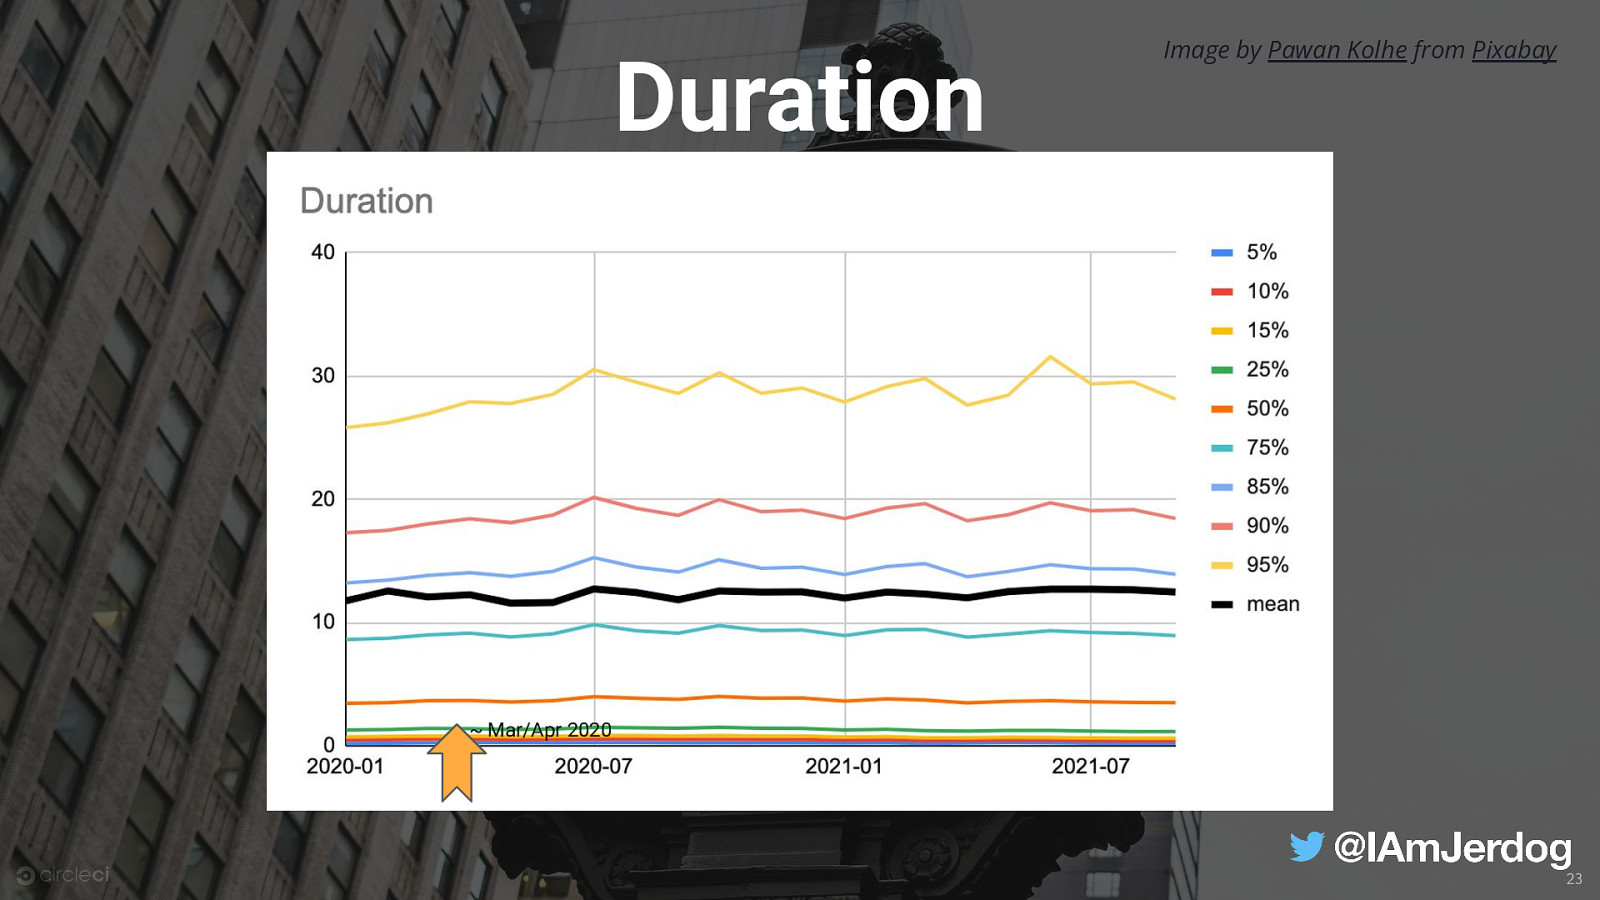
Duration Image by Pawan Kolhe from Pixabay ~ Mar/Apr 2020 23
Slide 24
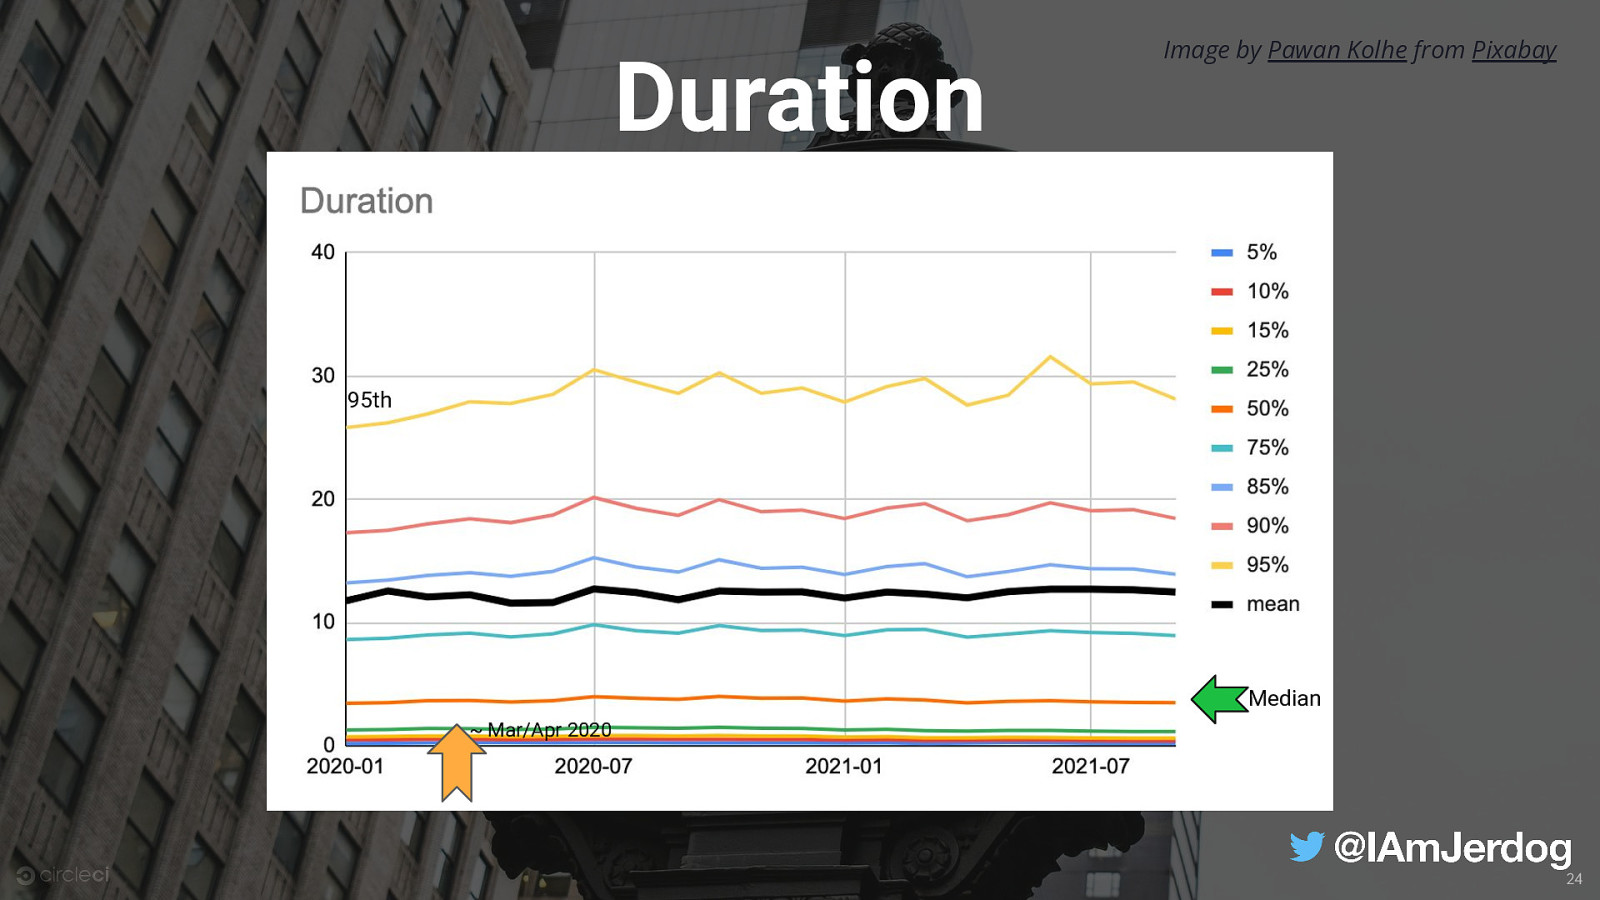
Duration Image by Pawan Kolhe from Pixabay 95th Median ~ Mar/Apr 2020 24
Slide 25

Photo by Brett Sayles from Pexels
Slide 26
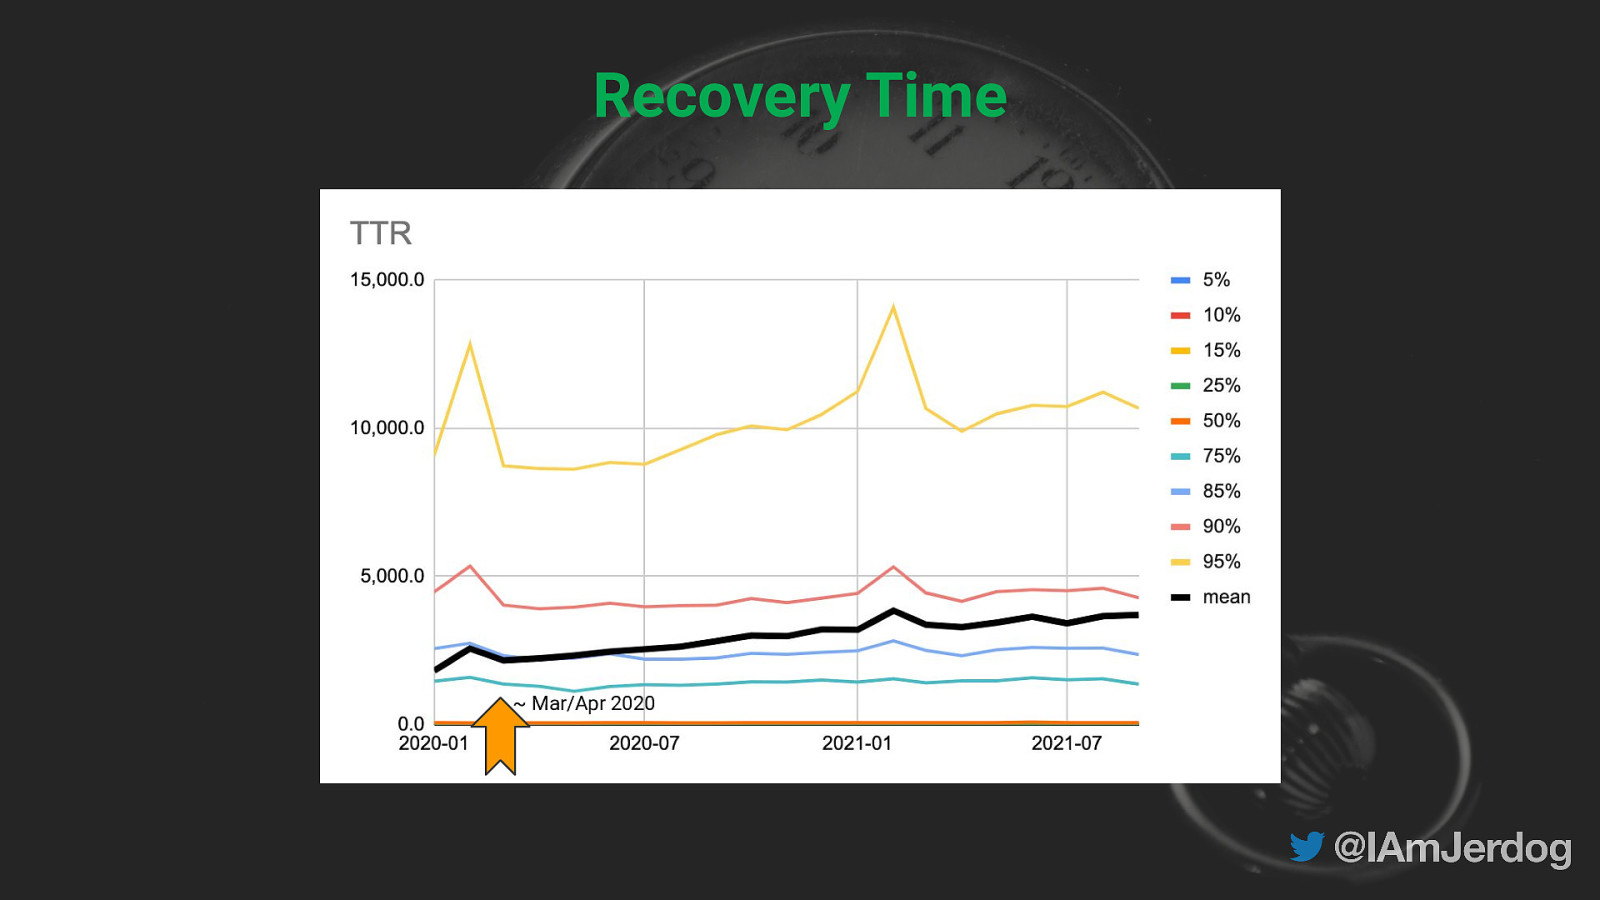
Mean time to recovery average time between a pipeline’s failure and its next success
Slide 27
Mean time to recovery shortest MTTR ∝ Duration
Slide 28
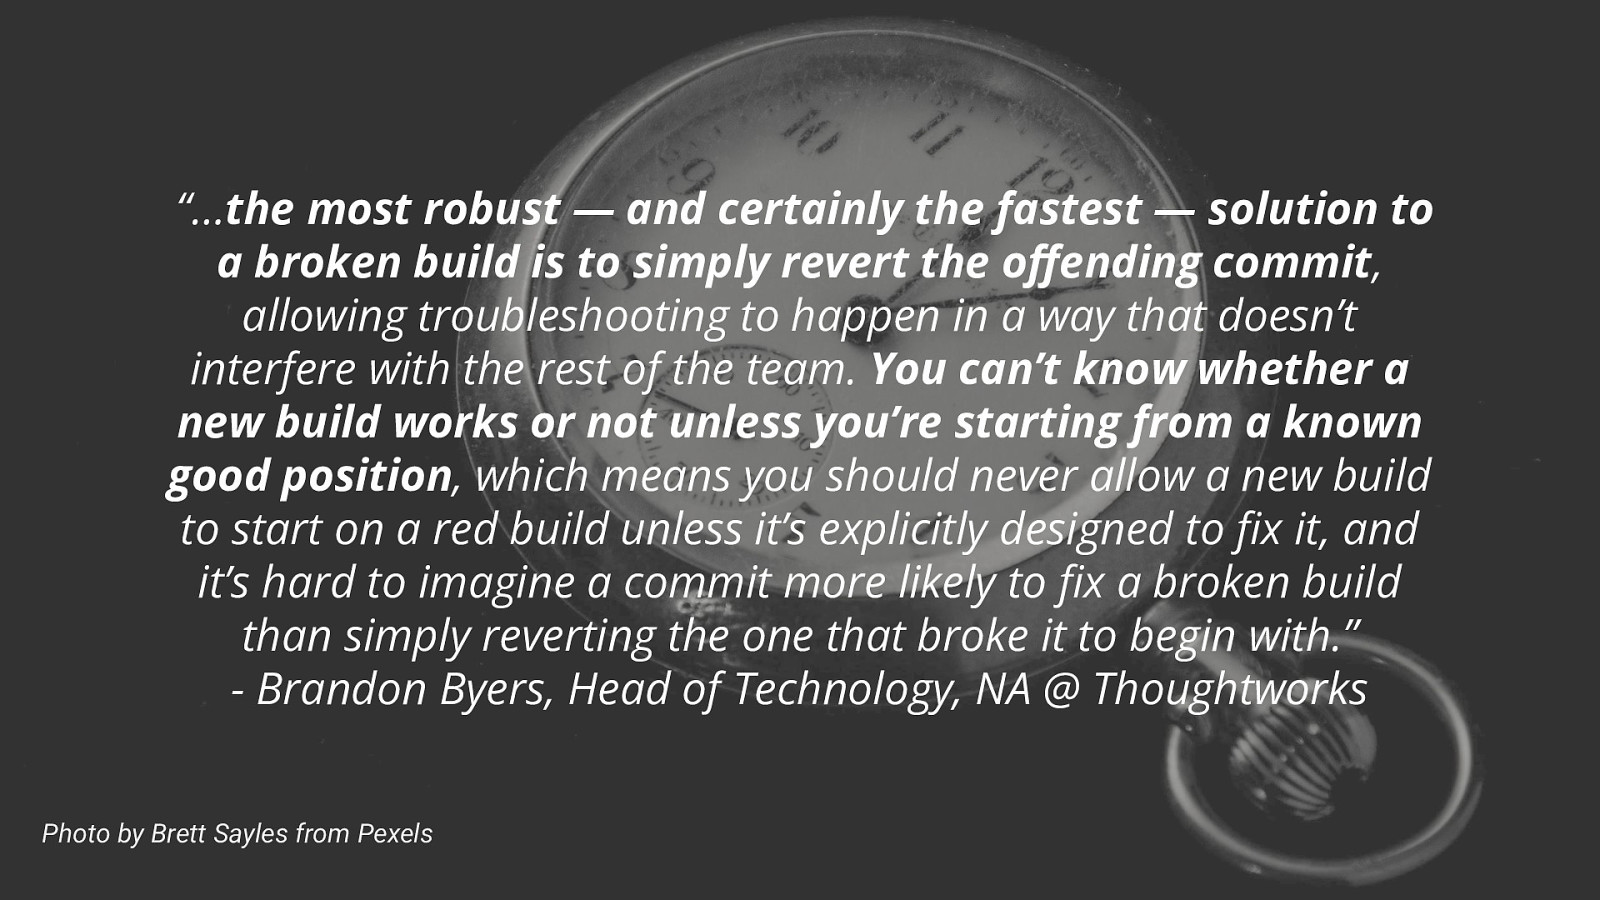
“…the most robust — and certainly the fastest — solution to a broken build is to simply revert the offending commit, allowing troubleshooting to happen in a way that doesn’t interfere with the rest of the team. You can’t know whether a new build works or not unless you’re starting from a known good position, which means you should never allow a new build to start on a red build unless it’s explicitly designed to fix it, and it’s hard to imagine a commit more likely to fix a broken build than simply reverting the one that broke it to begin with.” - Brandon Byers, Head of Technology, NA @ Thoughtworks Photo by Brett Sayles from Pexels 28
Slide 29

Recovery Time ~ Mar/Apr 2020
Slide 30

Recovery Time ~ Mar/Apr 2020
Slide 31
Recovery Time ~ Mar/Apr 2020
Slide 32

Recovery Time ~ Mar/Apr 2020
Slide 33

Photo by Lukas from Pexels
Slide 34
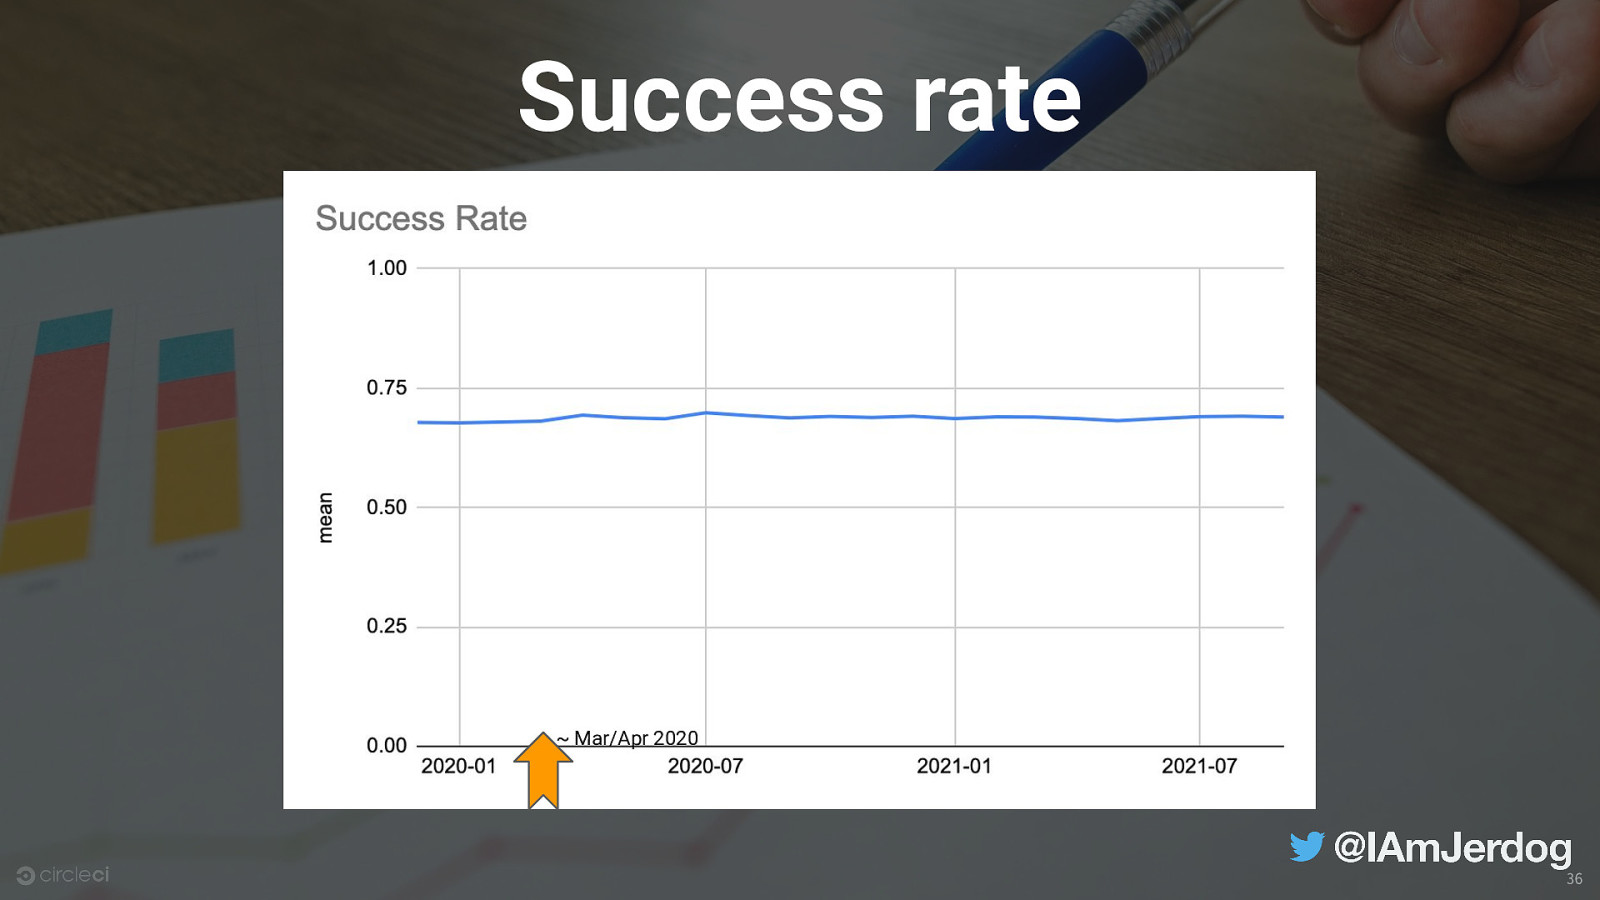
Success rate The number of passing runs ÷ total number of runs over a period of time 34
Slide 35

Success rate ~ Mar/Apr 2020 35
Slide 36
Success rate ~ Mar/Apr 2020 36
Slide 37

Success rate ~ Mar/Apr 2020 37
Slide 38
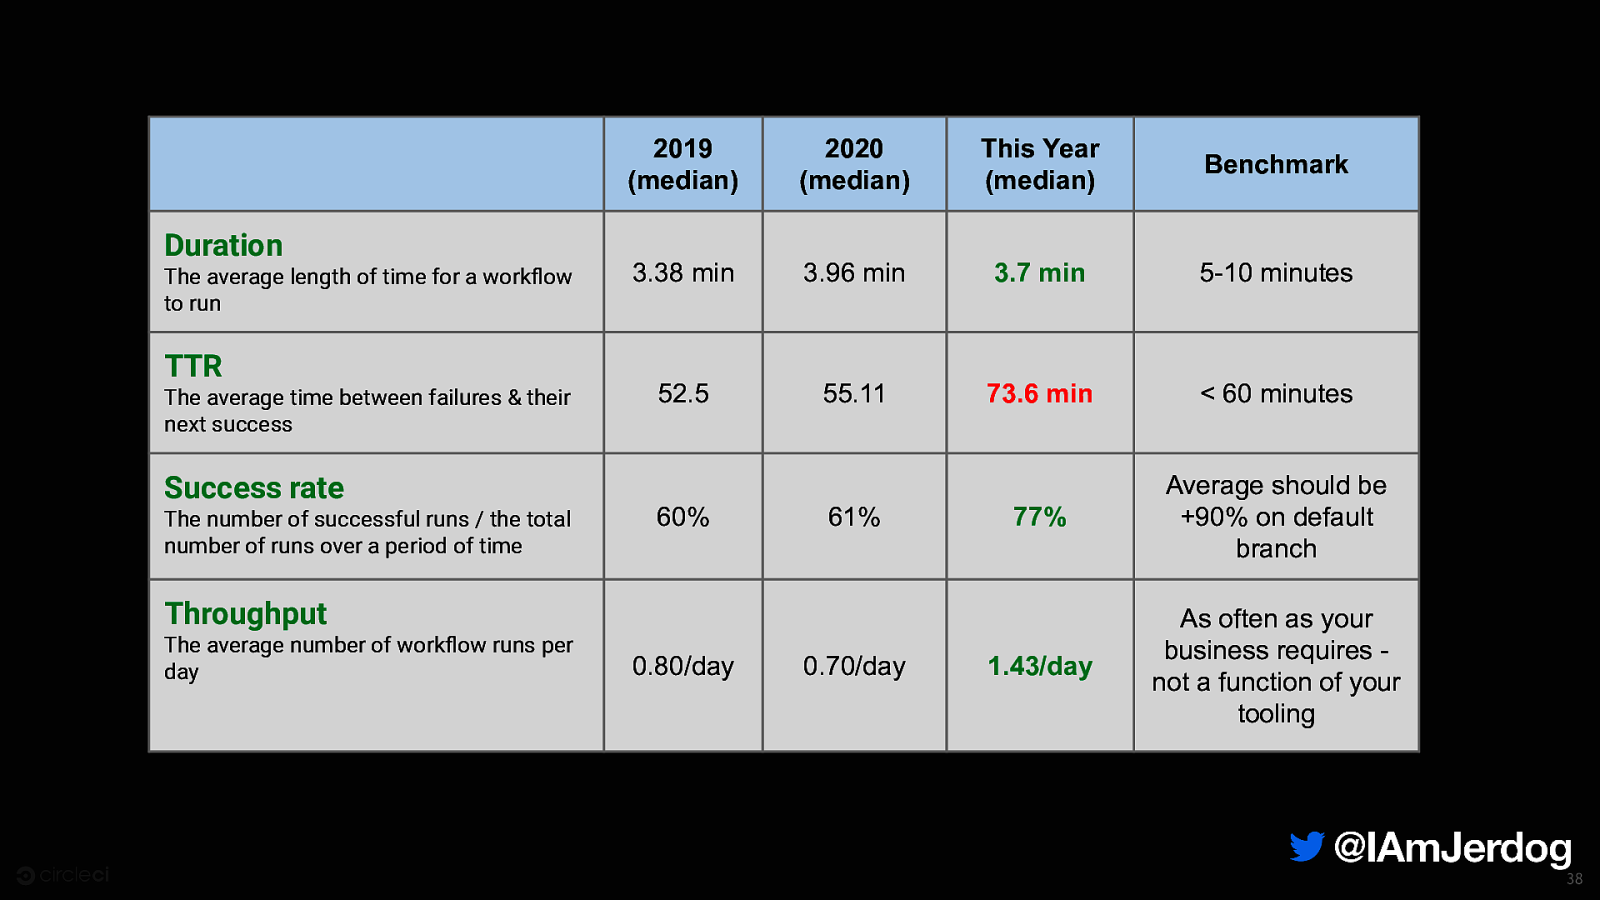
Duration The average length of time for a workflow to run TTR The average time between failures & their next success 2019 (median) 2020 (median) This Year (median) Benchmark 3.38 min 3.96 min 3.7 min 5-10 minutes 52.5 55.11 73.6 min < 60 minutes 77% Average should be +90% on default branch 1.43/day As often as your business requires not a function of your tooling Success rate The number of successful runs / the total number of runs over a period of time 60% 61% Throughput The average number of workflow runs per day 0.80/day 0.70/day 38
Slide 39

Extra Insights
Slide 40

202x has been a year.
Slide 41

“Don’t deploy on Friday” is not a thing.
Slide 42
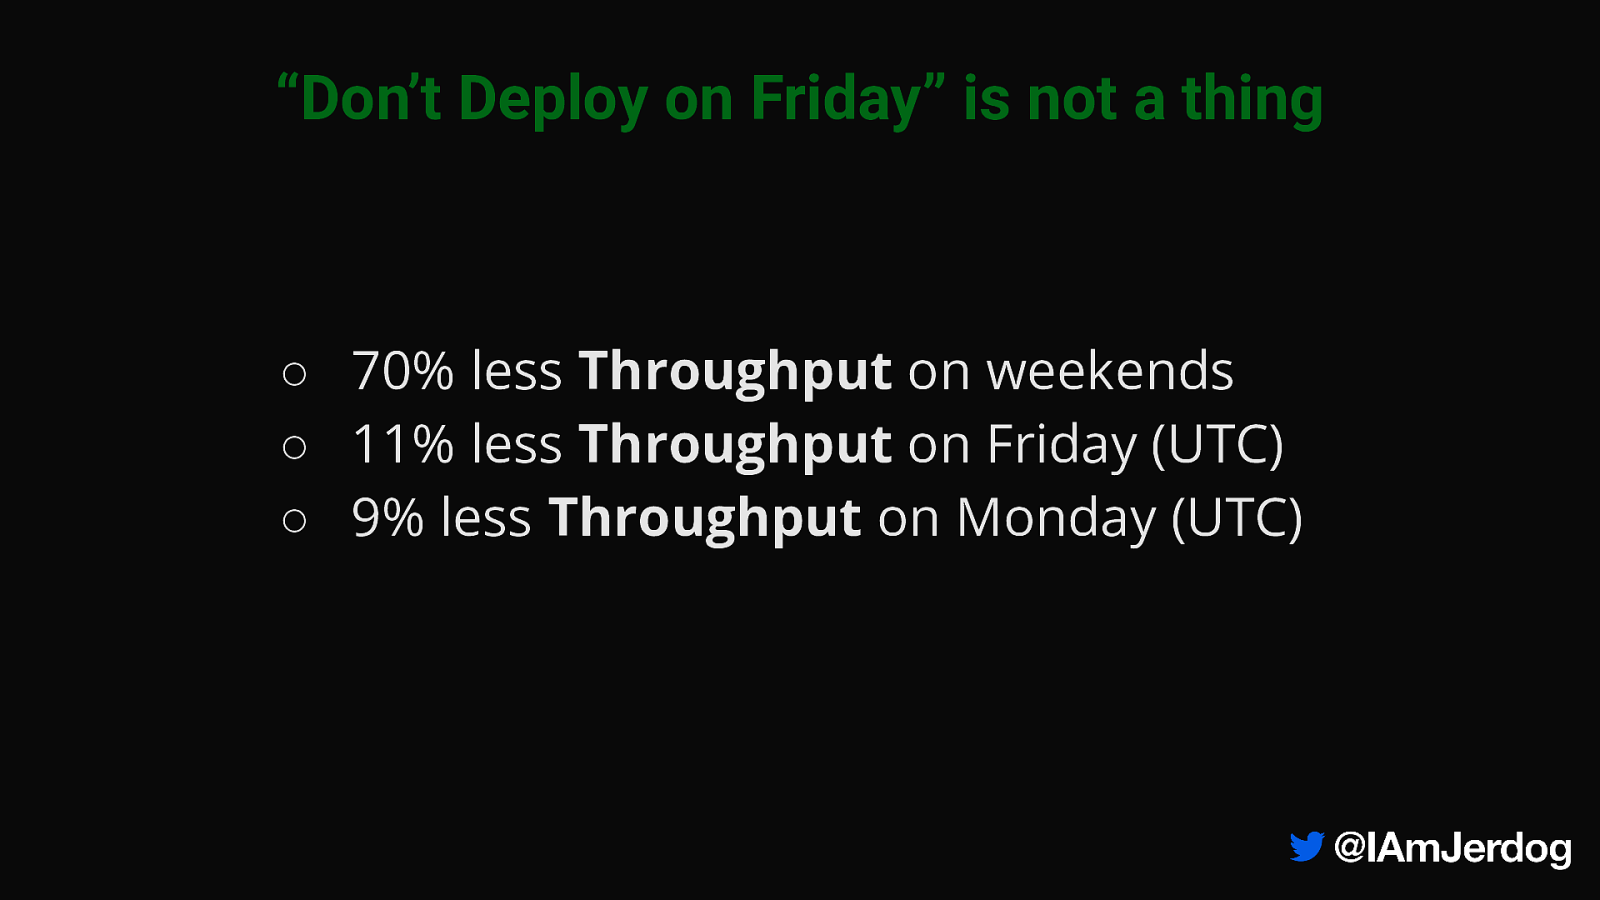
“Don’t Deploy on Friday” is not a thing ○ 70% less Throughput on weekends ○ 11% less Throughput on Friday (UTC) ○ 9% less Throughput on Monday (UTC)
Slide 43
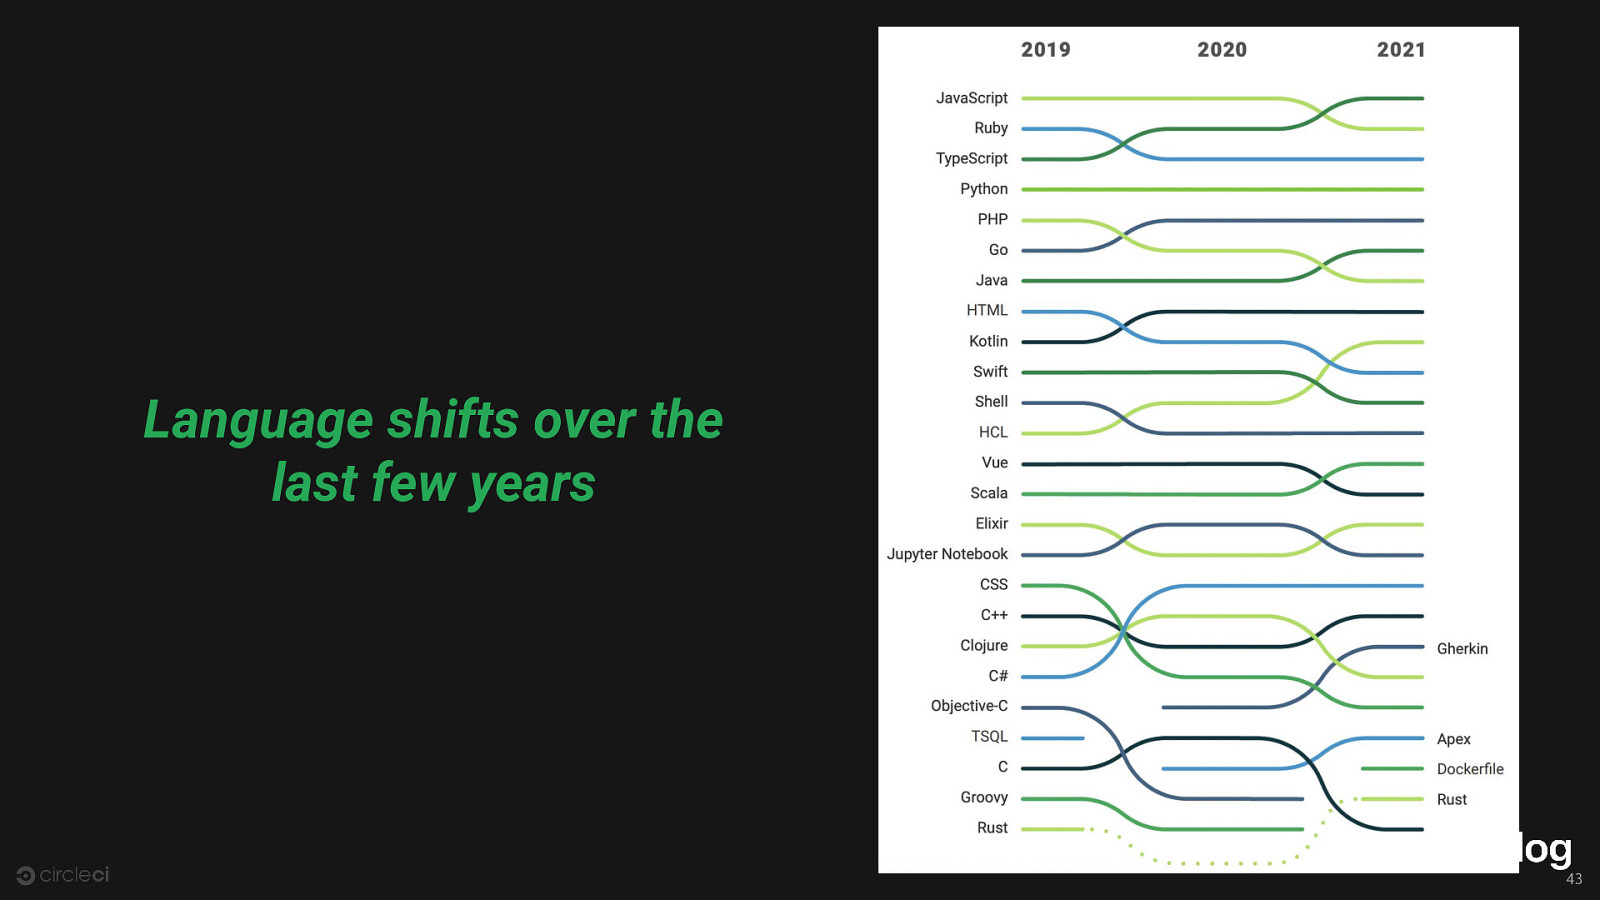
Language shifts over the last few years 43
Slide 44
44
Slide 45
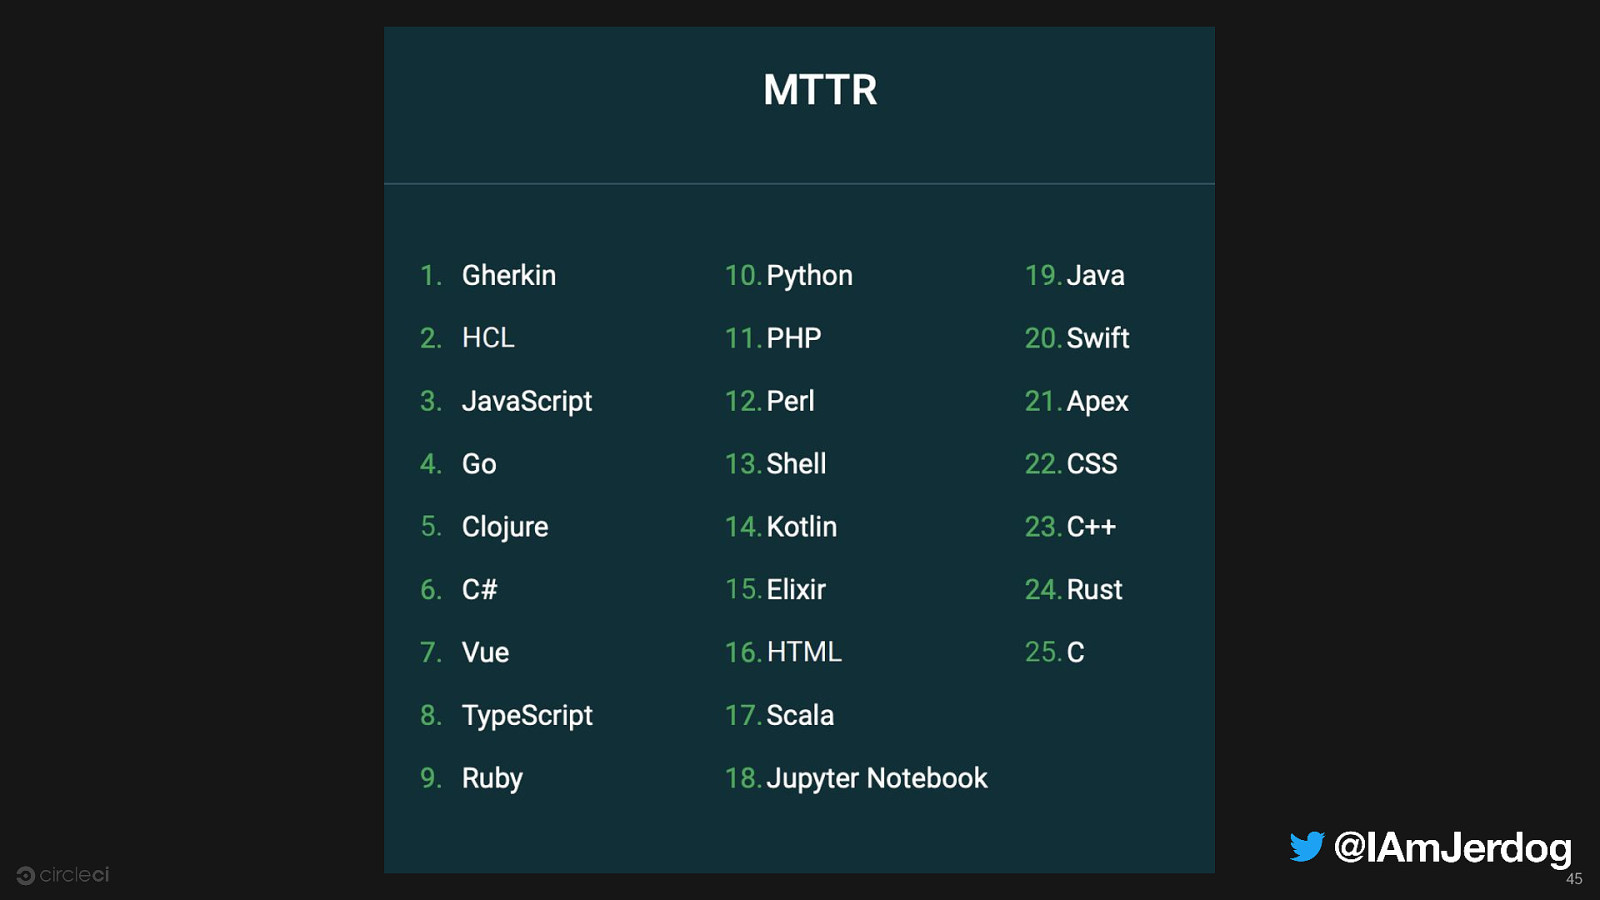
45
Slide 46
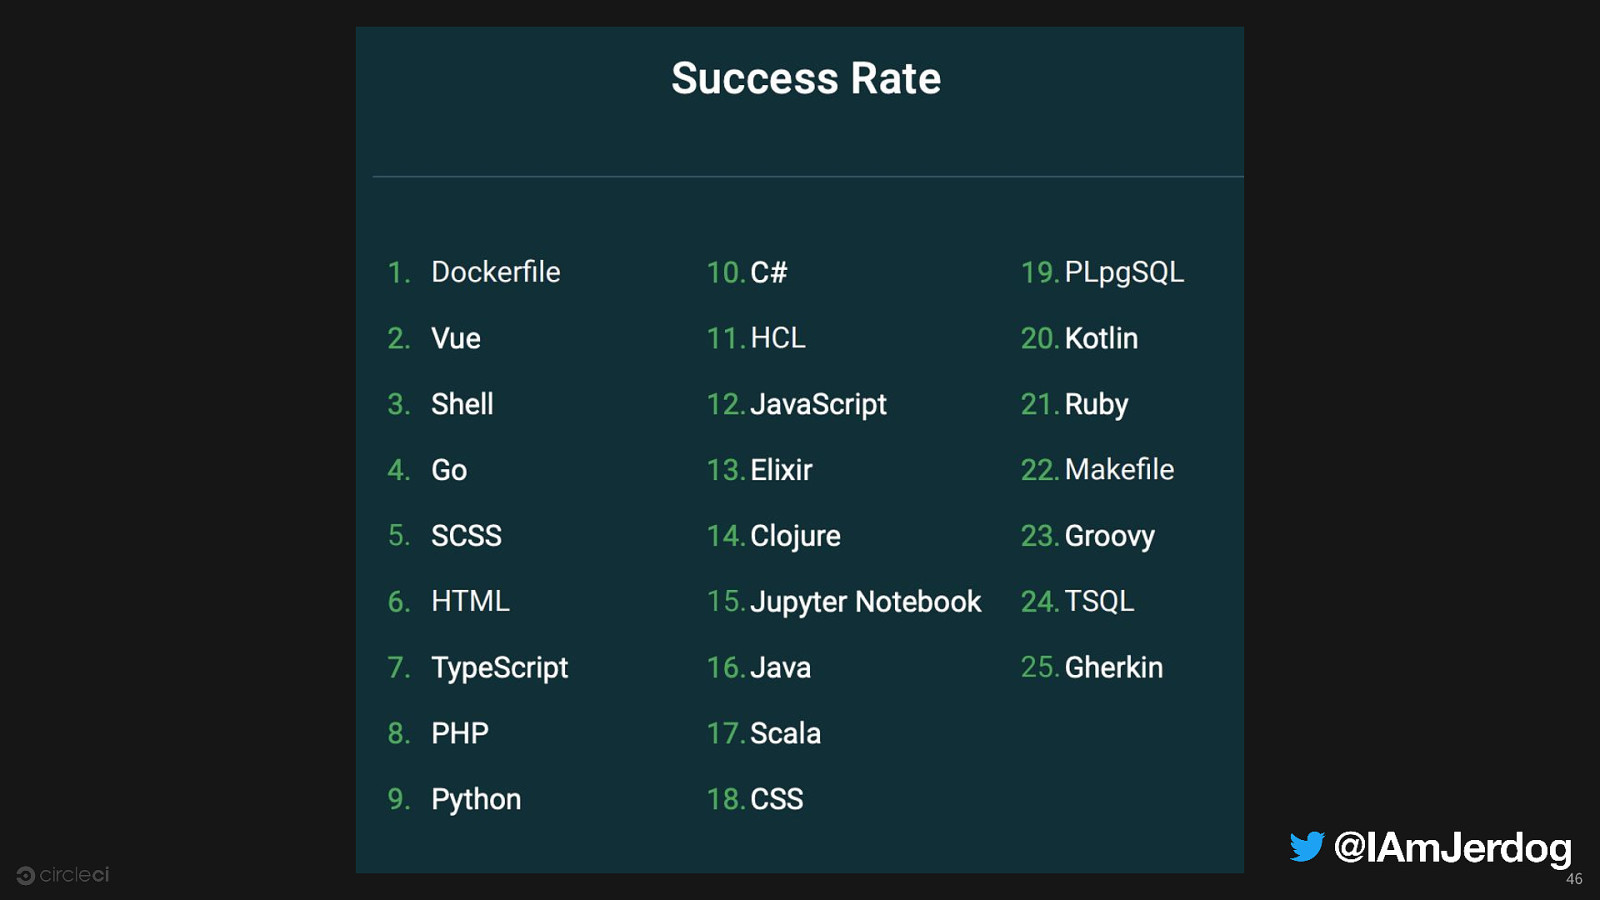
46
Slide 47
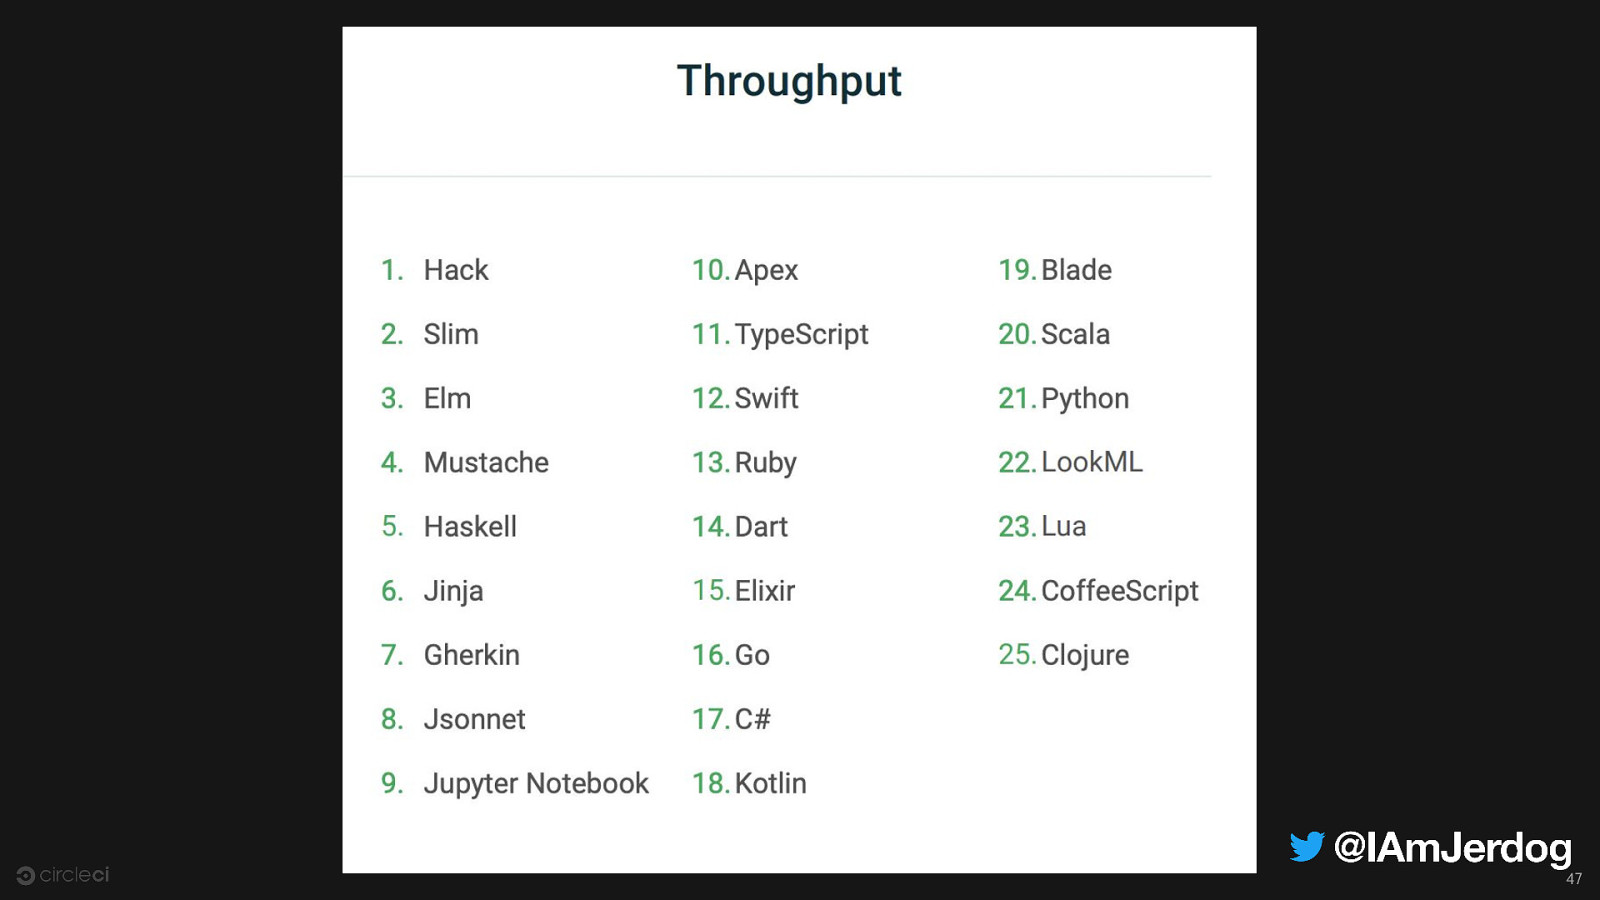
47
Slide 48
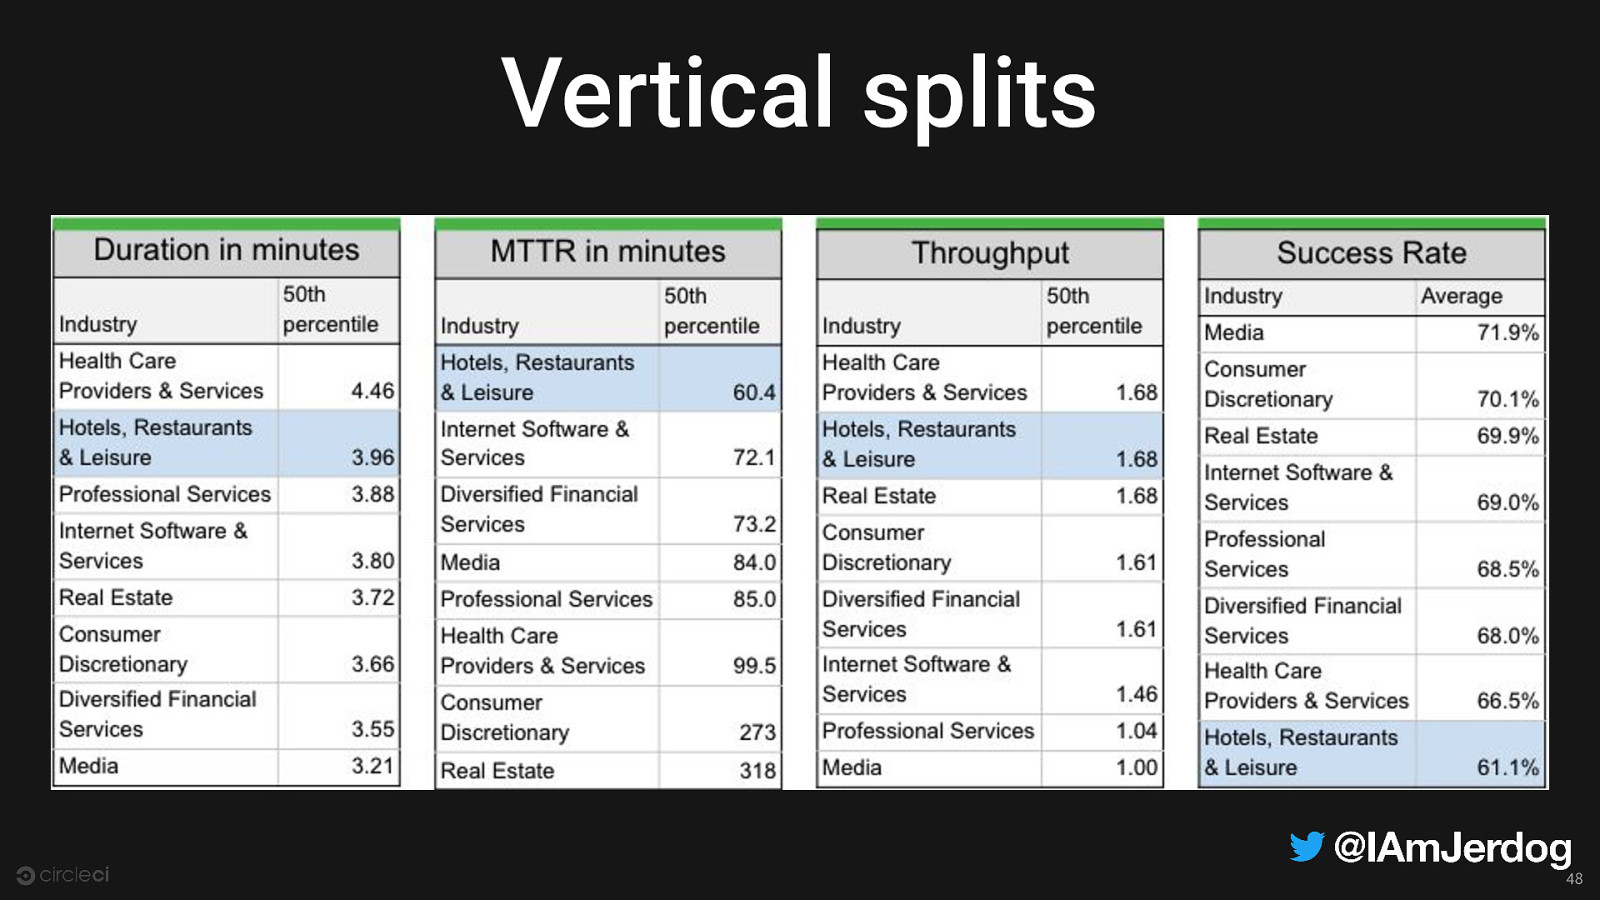
Vertical splits 48
Slide 49
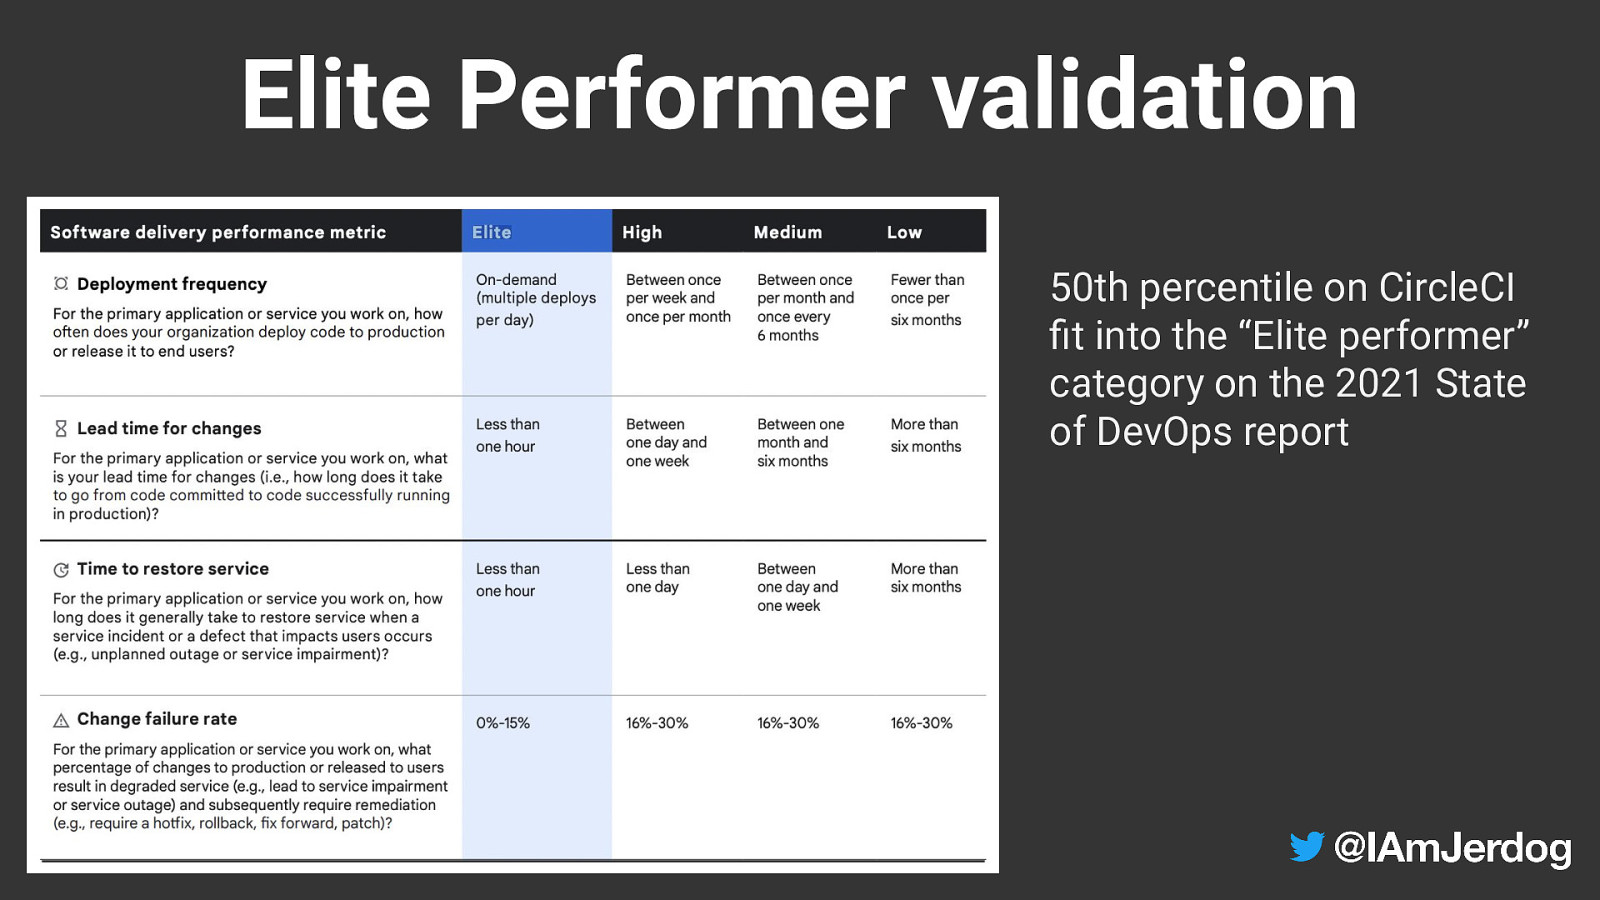
Elite Performer validation 50th percentile on CircleCI fit into the “Elite performer” category on the 2021 State of DevOps report
Slide 50

2020 Report Full 2022 Report https://circle.ci/ssd2020 https://circle.ci/ssd2022 50
Slide 51

Timeline.jerdog.me Thank you. For feedback and swag: circle.ci/jeremy IAmJerdog jerdog /in/jeremymeiss