High-performing engineering teams and the Holy Grail
Slide 1

Slide 2
Slide 3
Slide 4
Jeremy Meiss Director, DevRel & Community
Slide 5

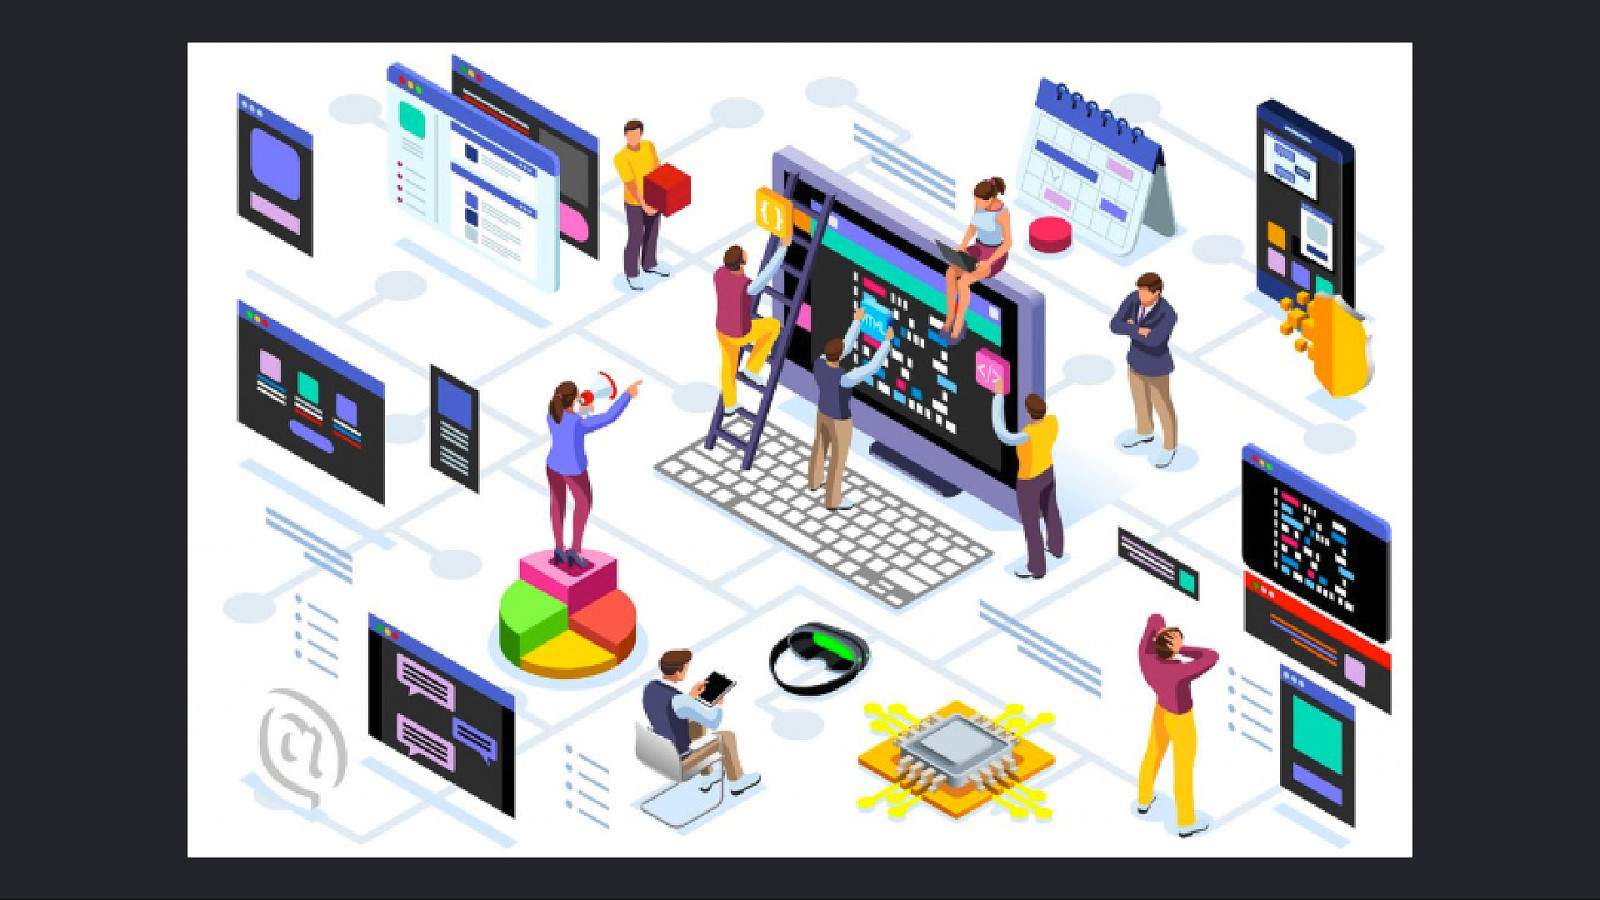
So back to the tech industry….
Slide 6

Slide 7

Forrester 2021 Total Economic Empact study Using best-in-class CI/CD platforms can provide: $7.8 million saved from shorter software development cycles. $4.3 million recuperated in lost developer productivity. 50% decrease in annual infrastructure spend. $1.7 million estimated value of improved code quality.
Slide 8

Slide 9

Slide 10

Slide 11
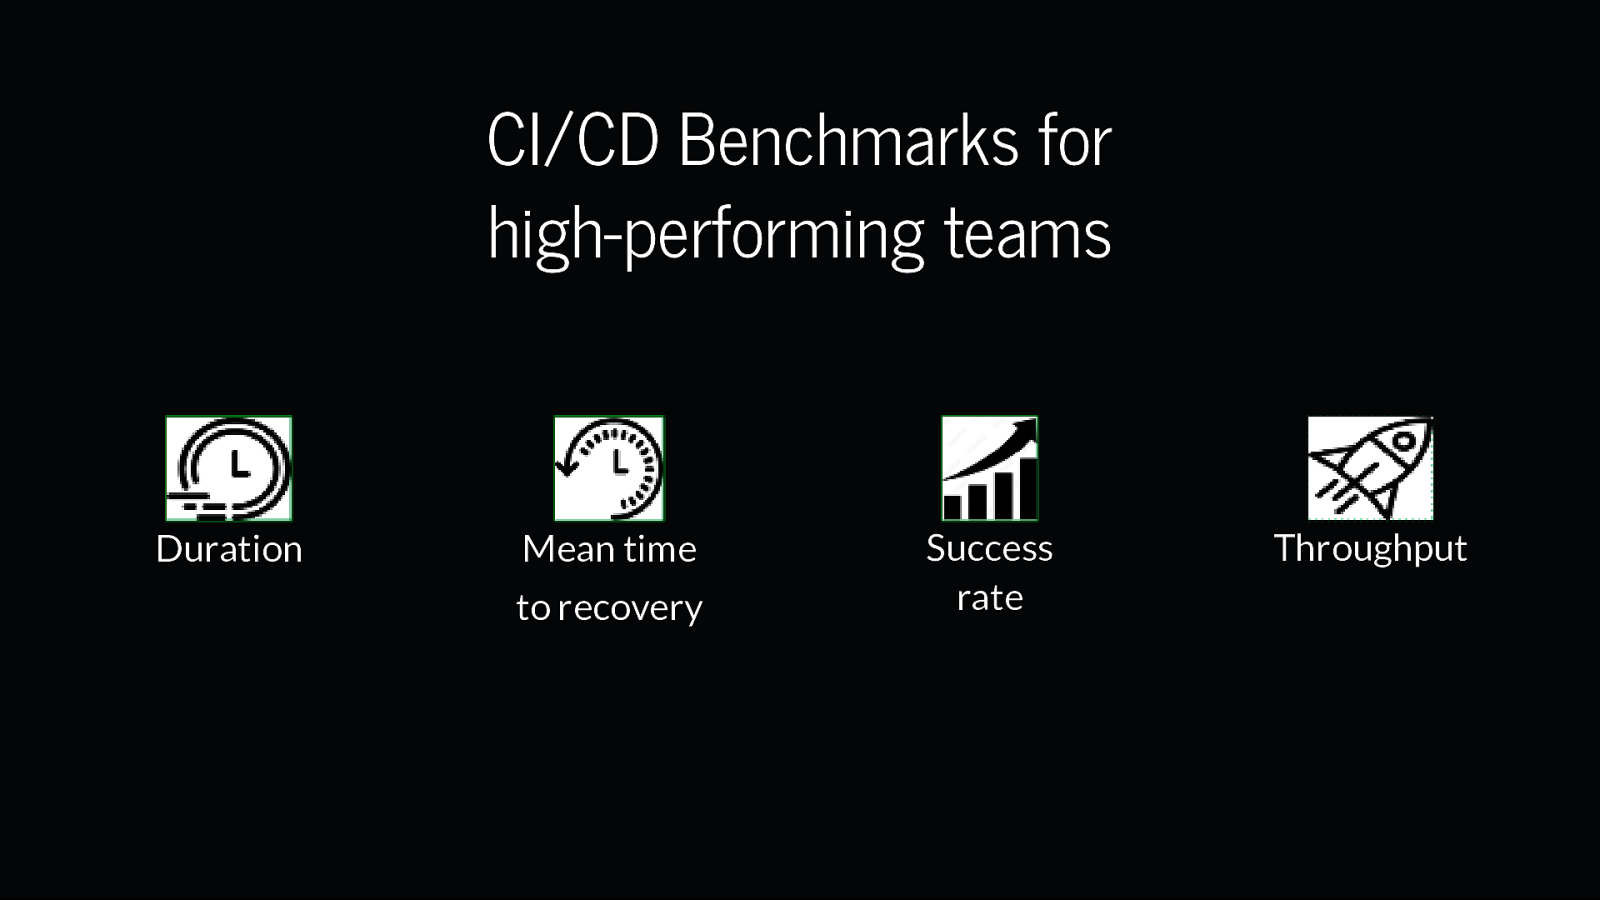
CI/CD Benchmarks for high-performing teams Duration Mean time to recovery Success rate Throughput
Slide 12

Slide 13

Slide 14

So what does the data say?
Slide 15

Duration the foundation of software engineering velocity, measures the average time in minutes required to move a unit of work through your pipeline
Slide 16

Slide 17

Slide 18

Slide 19
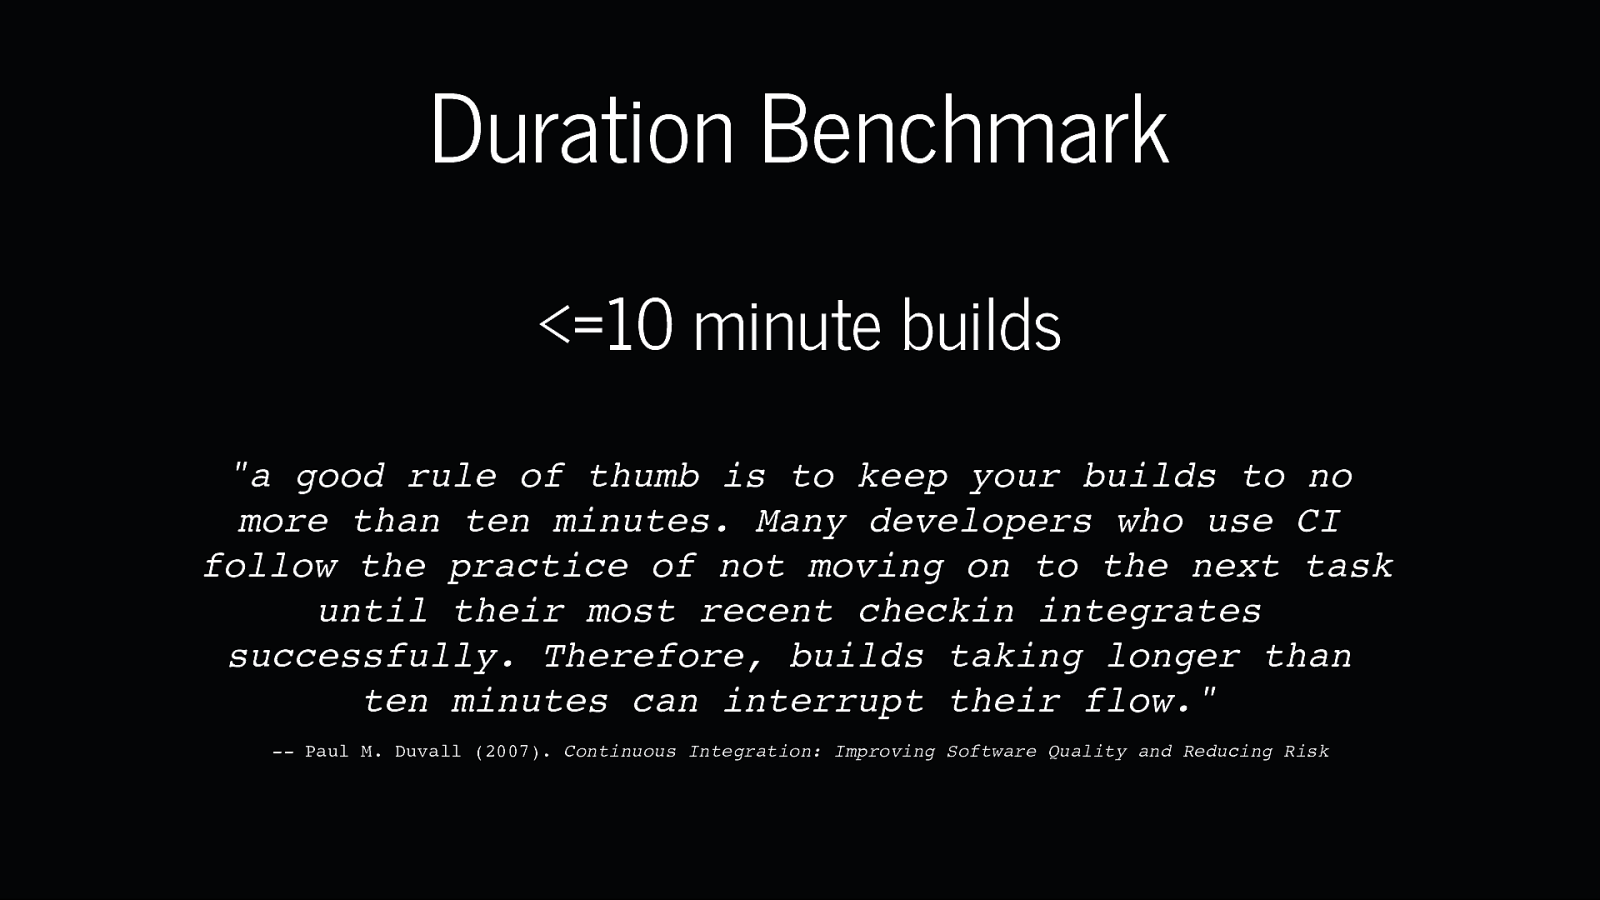
Duration Benchmark <=10 minute builds “a good rule of thumb is to keep your builds to no more than ten minutes. Many developers who use CI follow the practice of not moving on to the next task until their most recent checkin integrates successfully. Therefore, builds taking longer than ten minutes can interrupt their flow.” — Paul M. Duvall (2007). Continuous Integration: Improving Software Quality and Reducing Risk
Slide 20
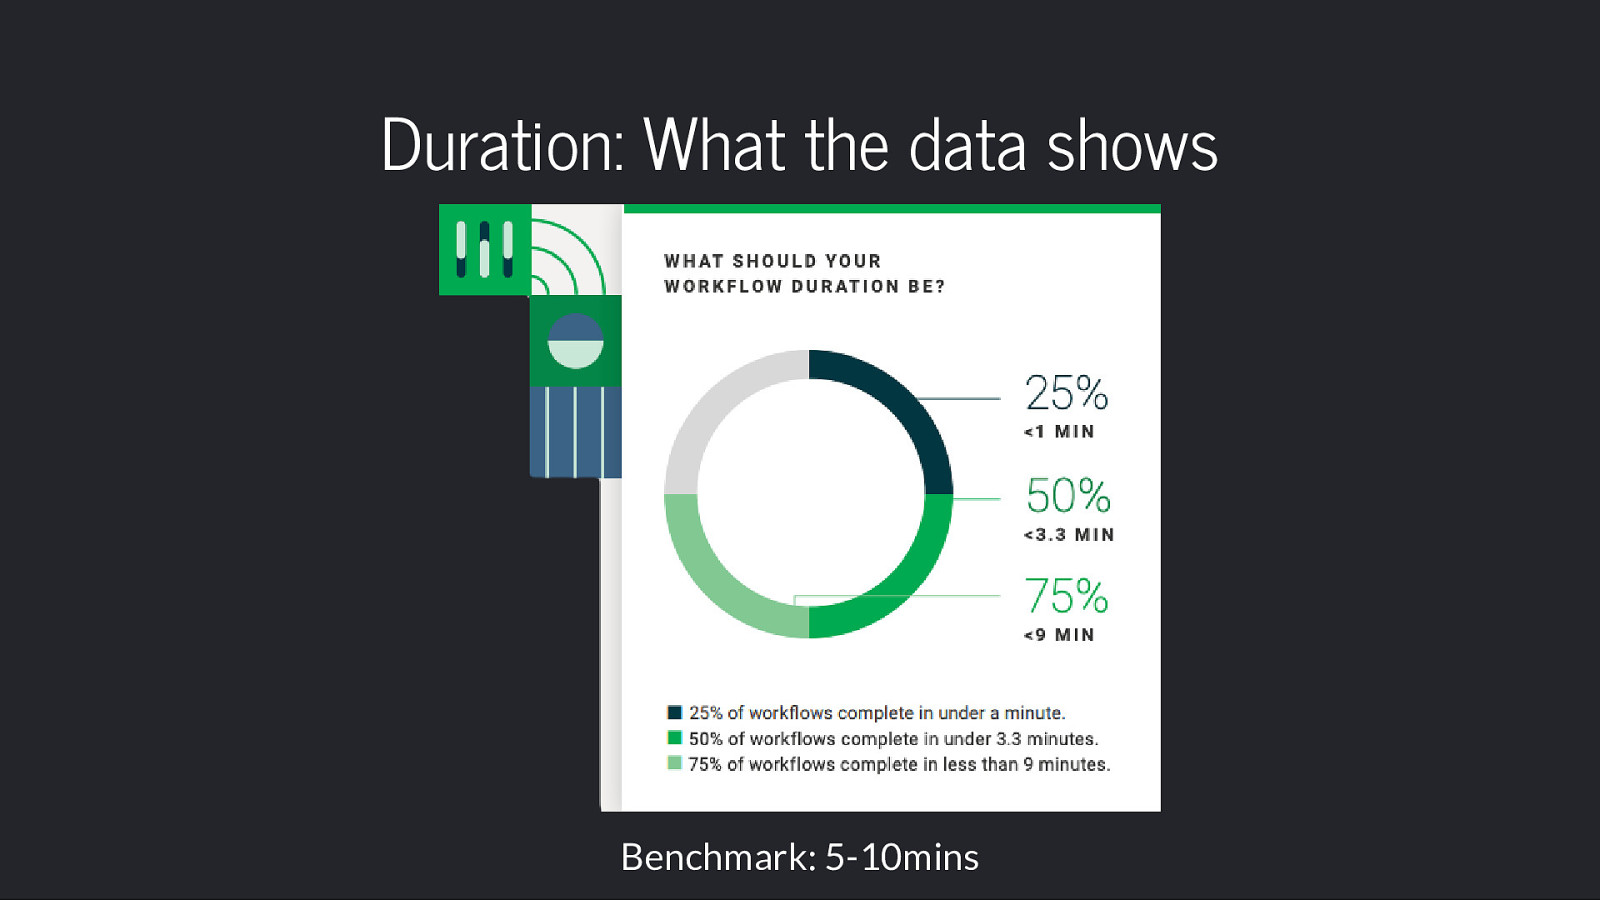
Duration: What the data shows Benchmark: 5-10mins
Slide 21

“Why so much lower than the Duration benchmark?”
Slide 22
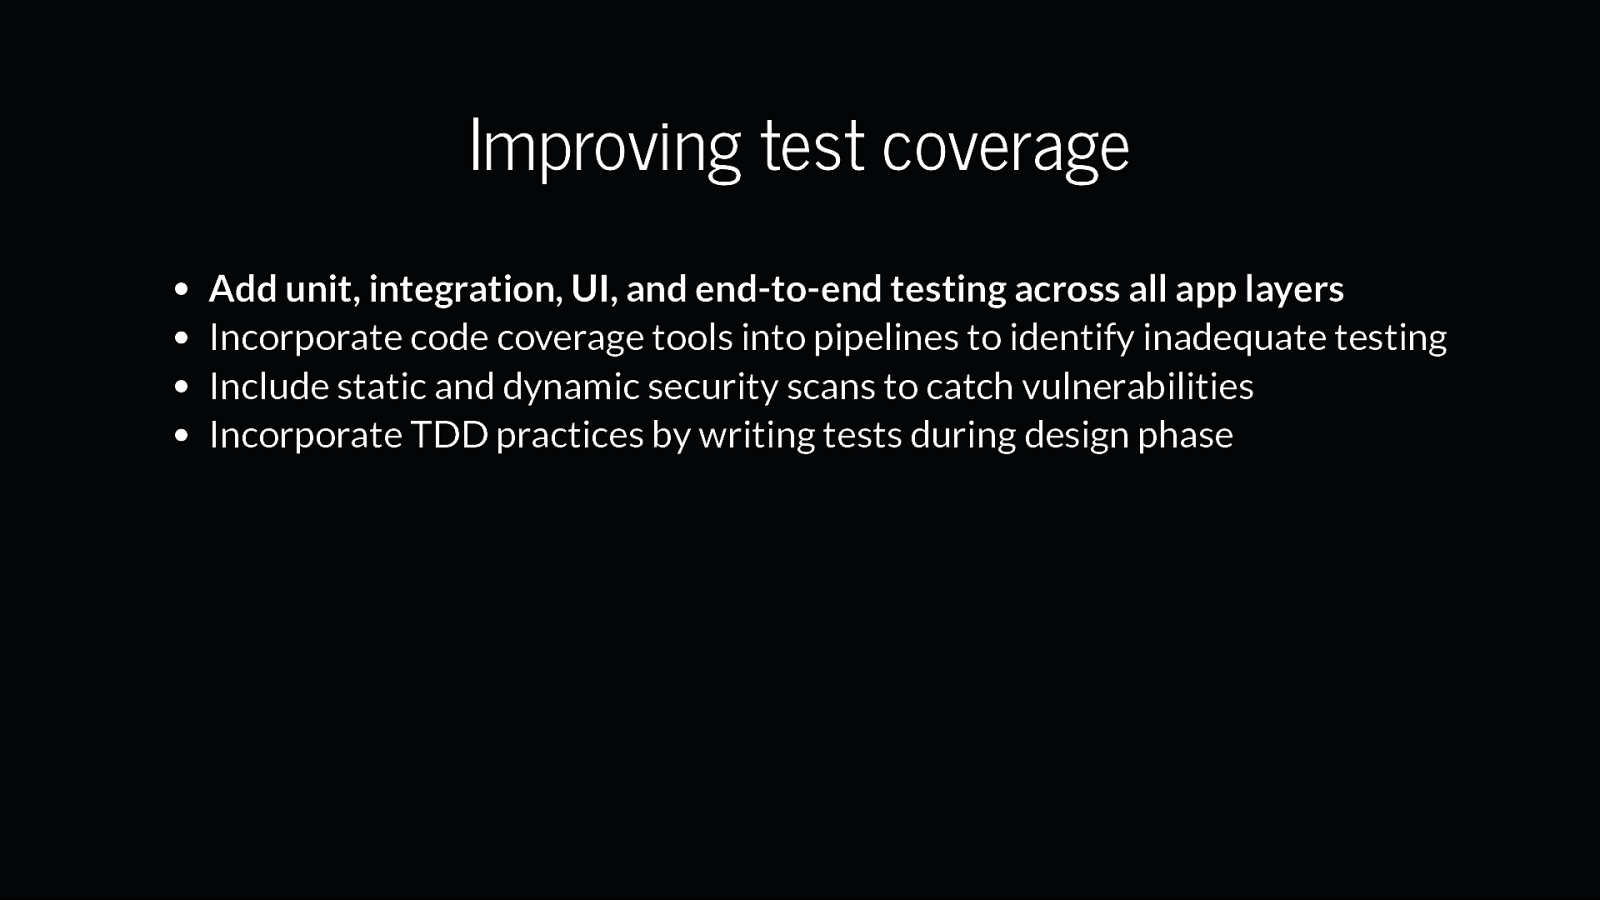
Improving test coverage Add unit, integration, UI, and end-to-end testing across all app layers Incorporate code coverage tools into pipelines to identify inadequate testing Include static and dynamic security scans to catch vulnerabilities Incorporate TDD practices by writing tests during design phase
Slide 23
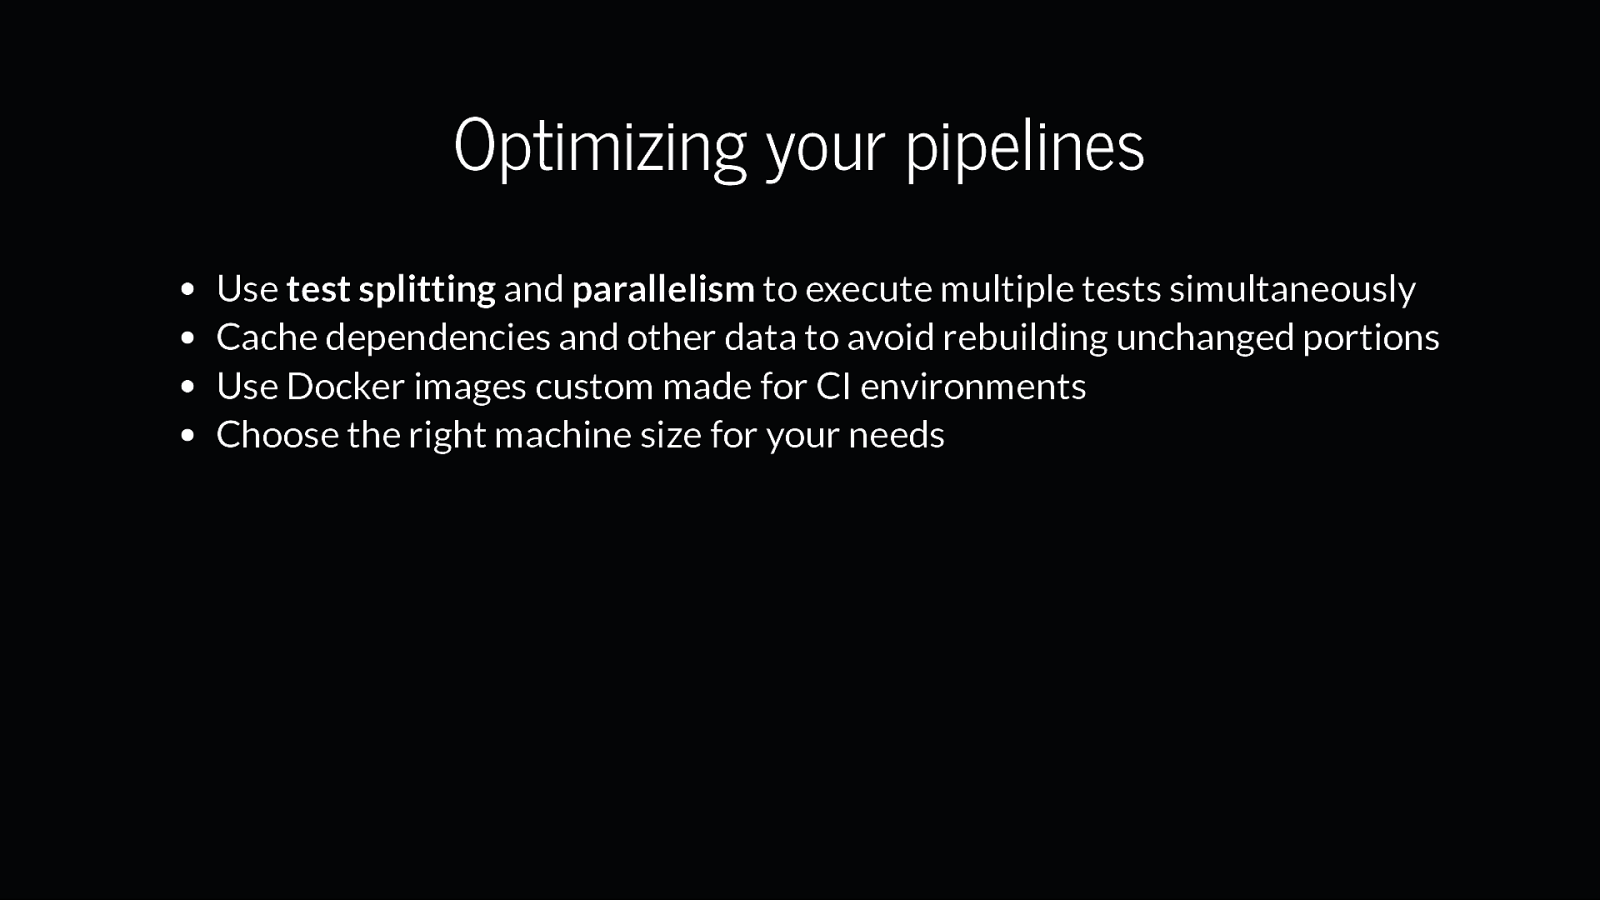
Optimizing your pipelines Use test splitting and parallelism to execute multiple tests simultaneously Cache dependencies and other data to avoid rebuilding unchanged portions Use Docker images custom made for CI environments Choose the right machine size for your needs
Slide 24

Slide 25
Mean time to Recovery the average time required to go from a failed build signal to a successful pipeline run
Slide 26
Mean time to recovery is indicative of resilience
Slide 27
Slide 28
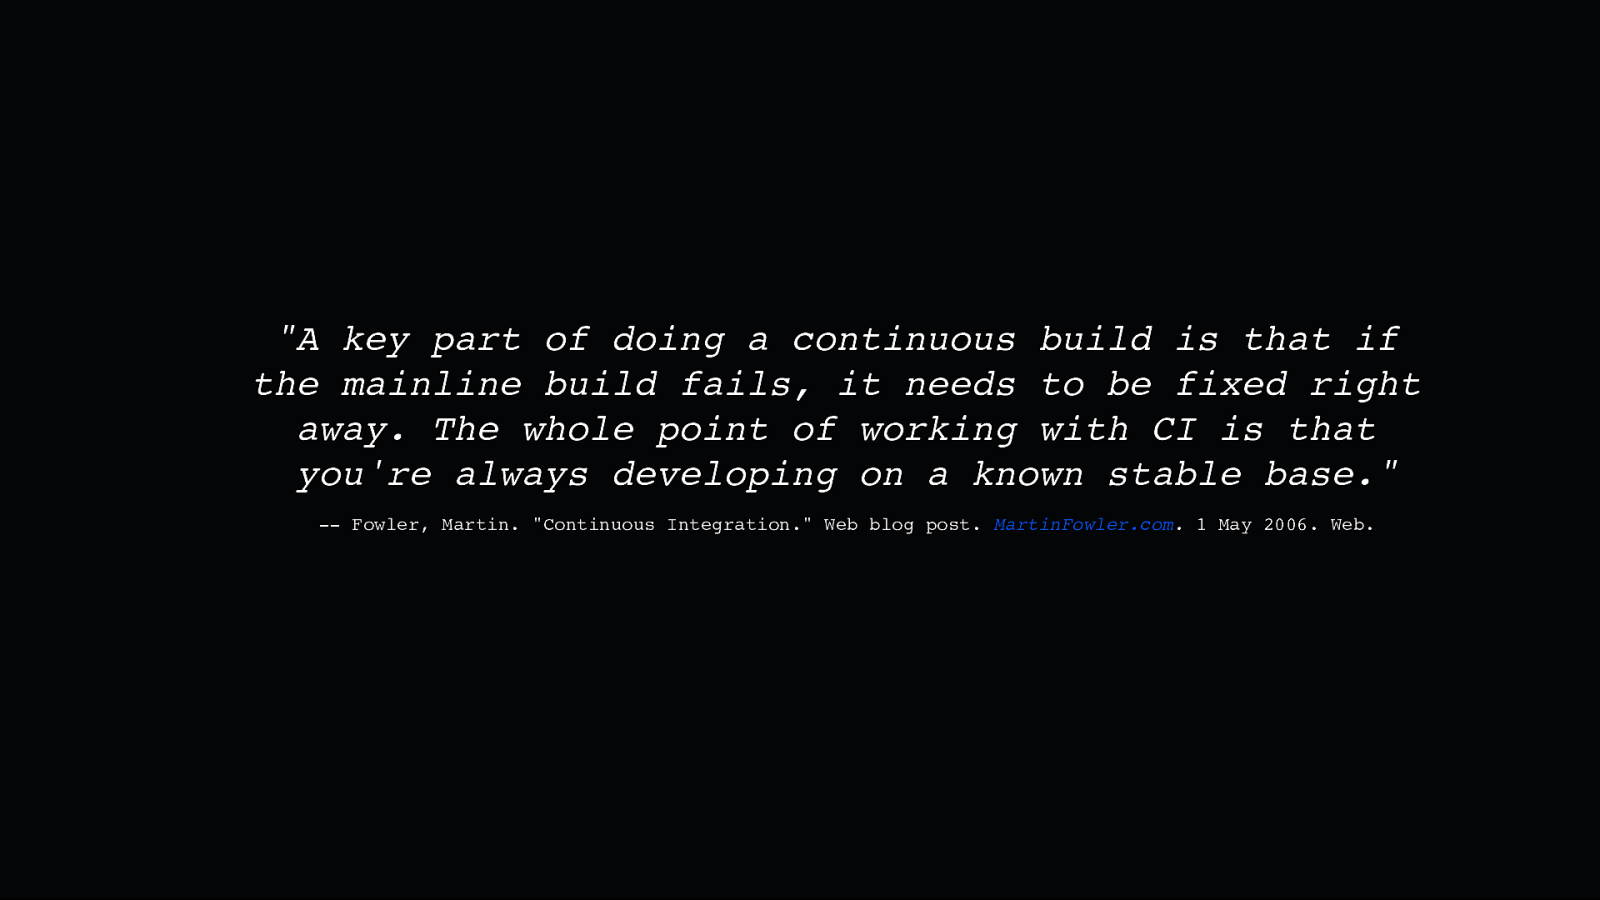
“A key part of doing a continuous build is that if the mainline build fails, it needs to be fixed right away. The whole point of working with CI is that you’re always developing on a known stable base.” — Fowler, Martin. “Continuous Integration.” Web blog post. MartinFowler.com. 1 May 2006. Web.
Slide 29

Slide 30
<=60min MTTR on default branches
Slide 31

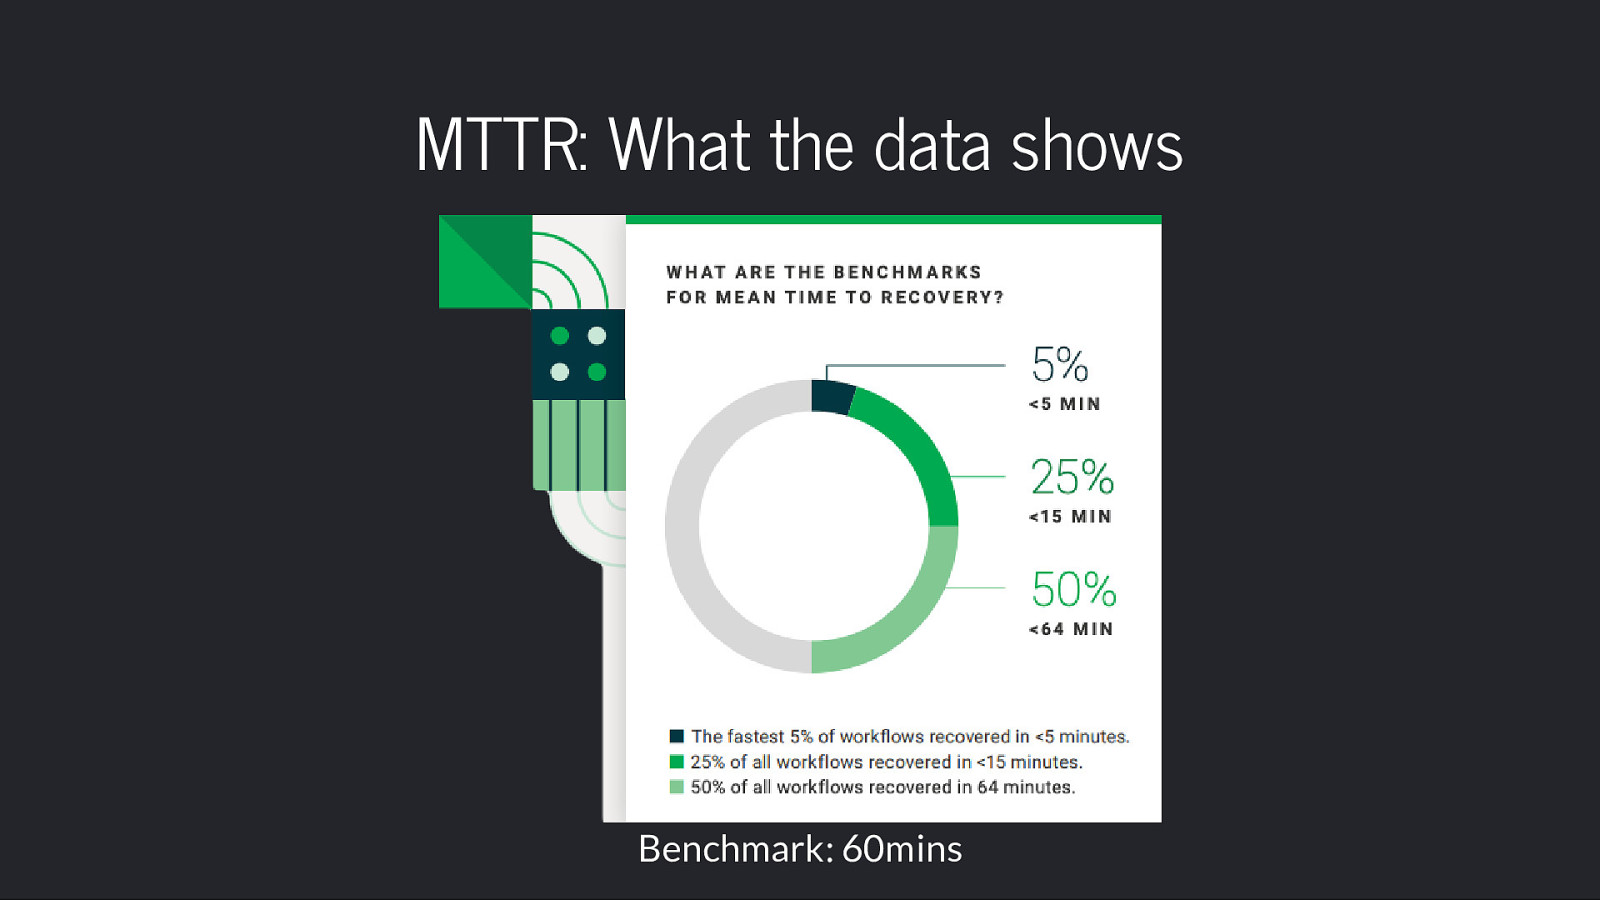
MTTR: What the data shows Benchmark: 60mins
Slide 32
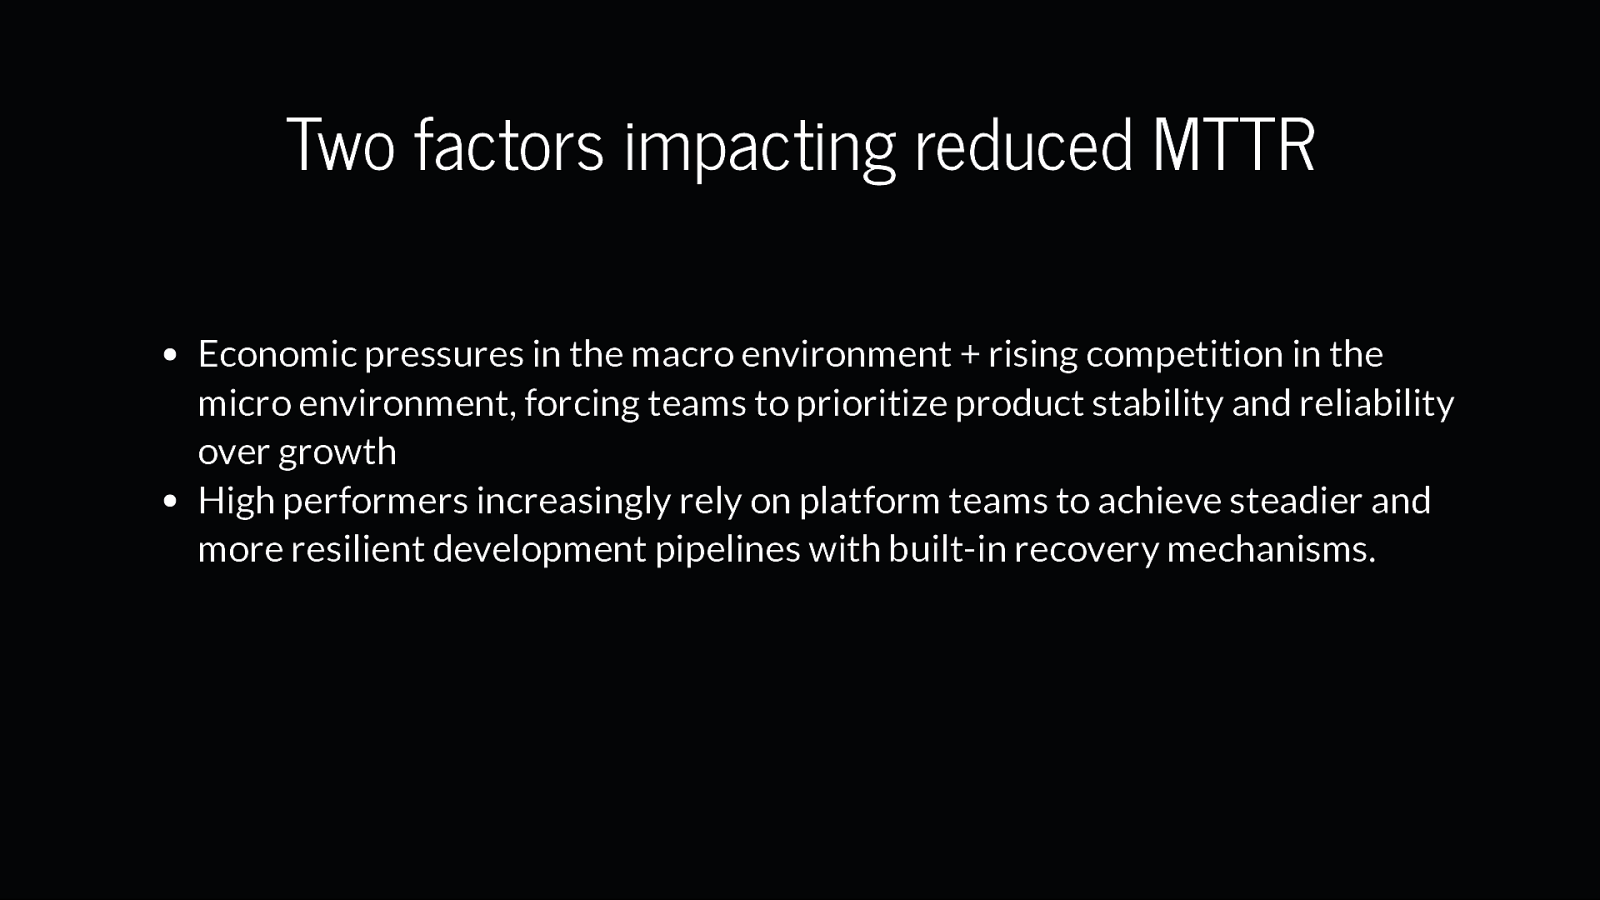
Two factors impacting reduced MTTR Economic pressures in the macro environment + rising competition in the micro environment, forcing teams to prioritize product stability and reliability over growth High performers increasingly rely on platform teams to achieve steadier and more resilient development pipelines with built-in recovery mechanisms.
Slide 33
MTTR: What the data shows Benchmark: 60mins
Slide 34

Treat your default branch as the lifeblood of your project
Slide 35
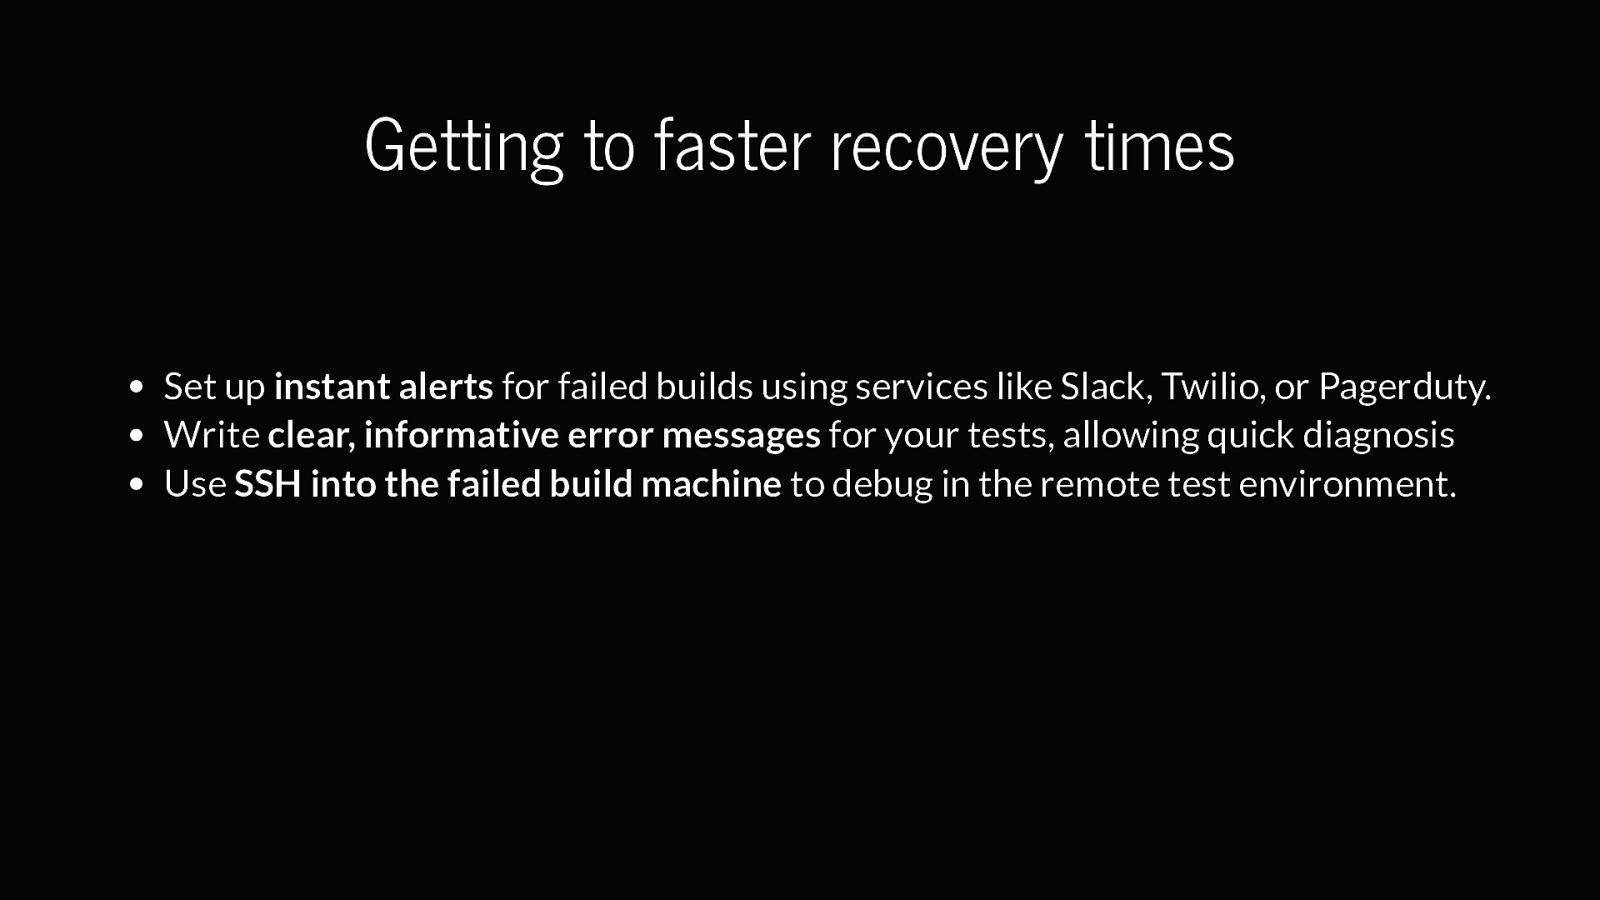
Getting to faster recovery times Set up instant alerts for failed builds using services like Slack, Twilio, or Pagerduty. Write clear, informative error messages for your tests, allowing quick diagnosis Use SSH into the failed build machine to debug in the remote test environment.
Slide 36
Success Rate number of passing runs divided by the total number of runs over a period of time
Slide 37

Slide 38
Success Rate Benchmark 90%+ Success rate on default branches
Slide 39
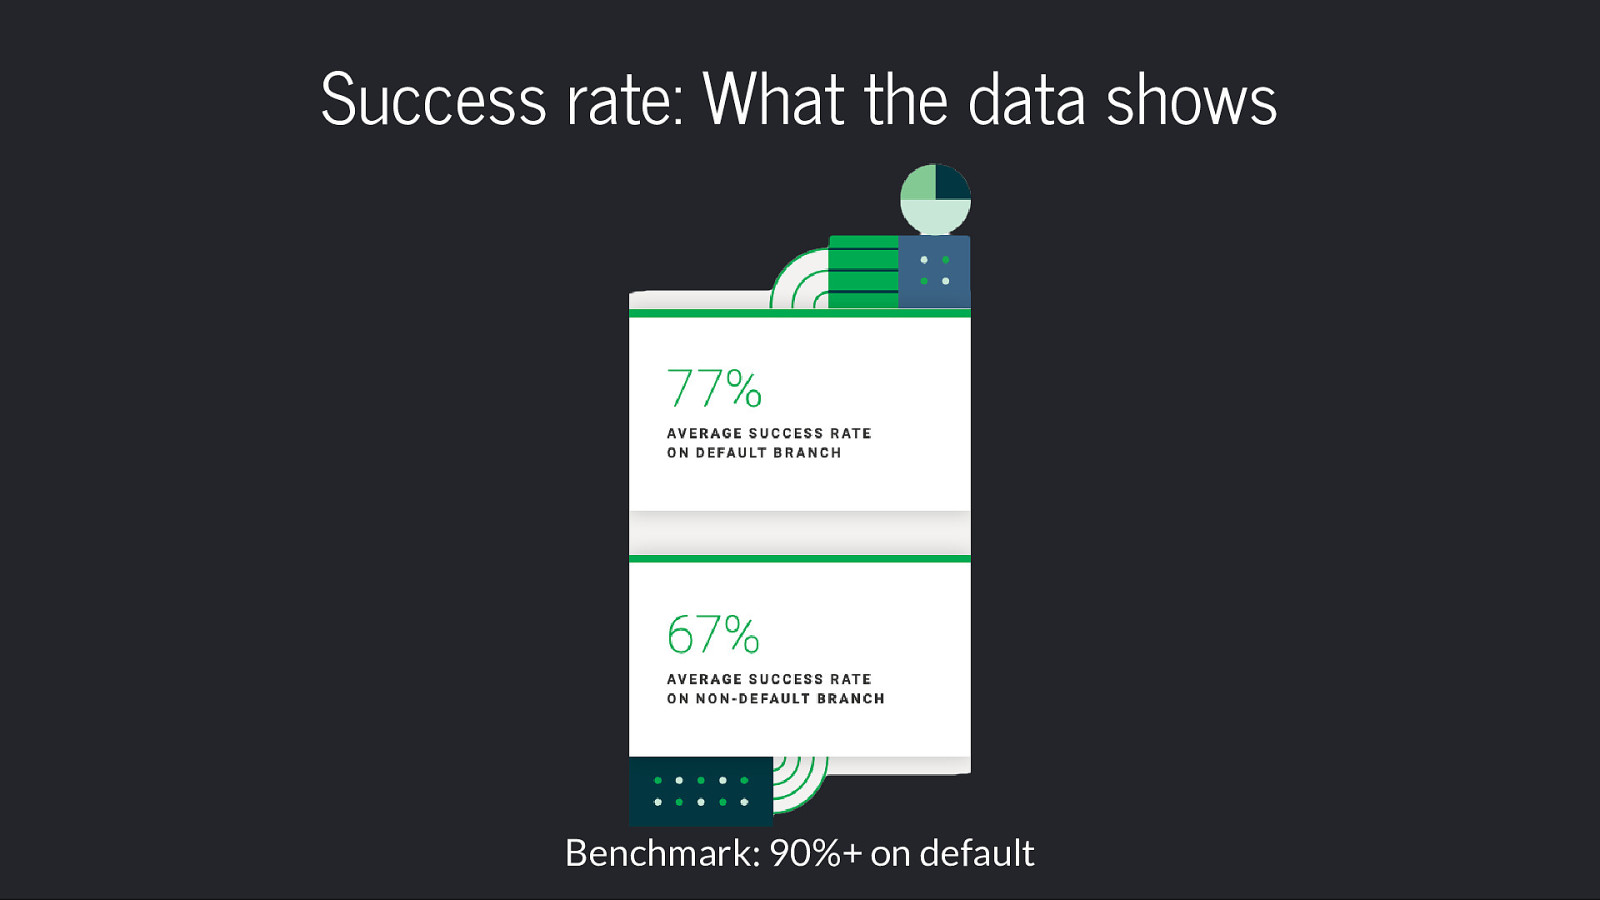
Success rate: What the data shows Benchmark: 90%+ on default
Slide 40

Slide 41
Throughput average number of workflow runs that an organization completes on a given project per day
Slide 42

Slide 43

Slide 44

It depends.
Slide 45
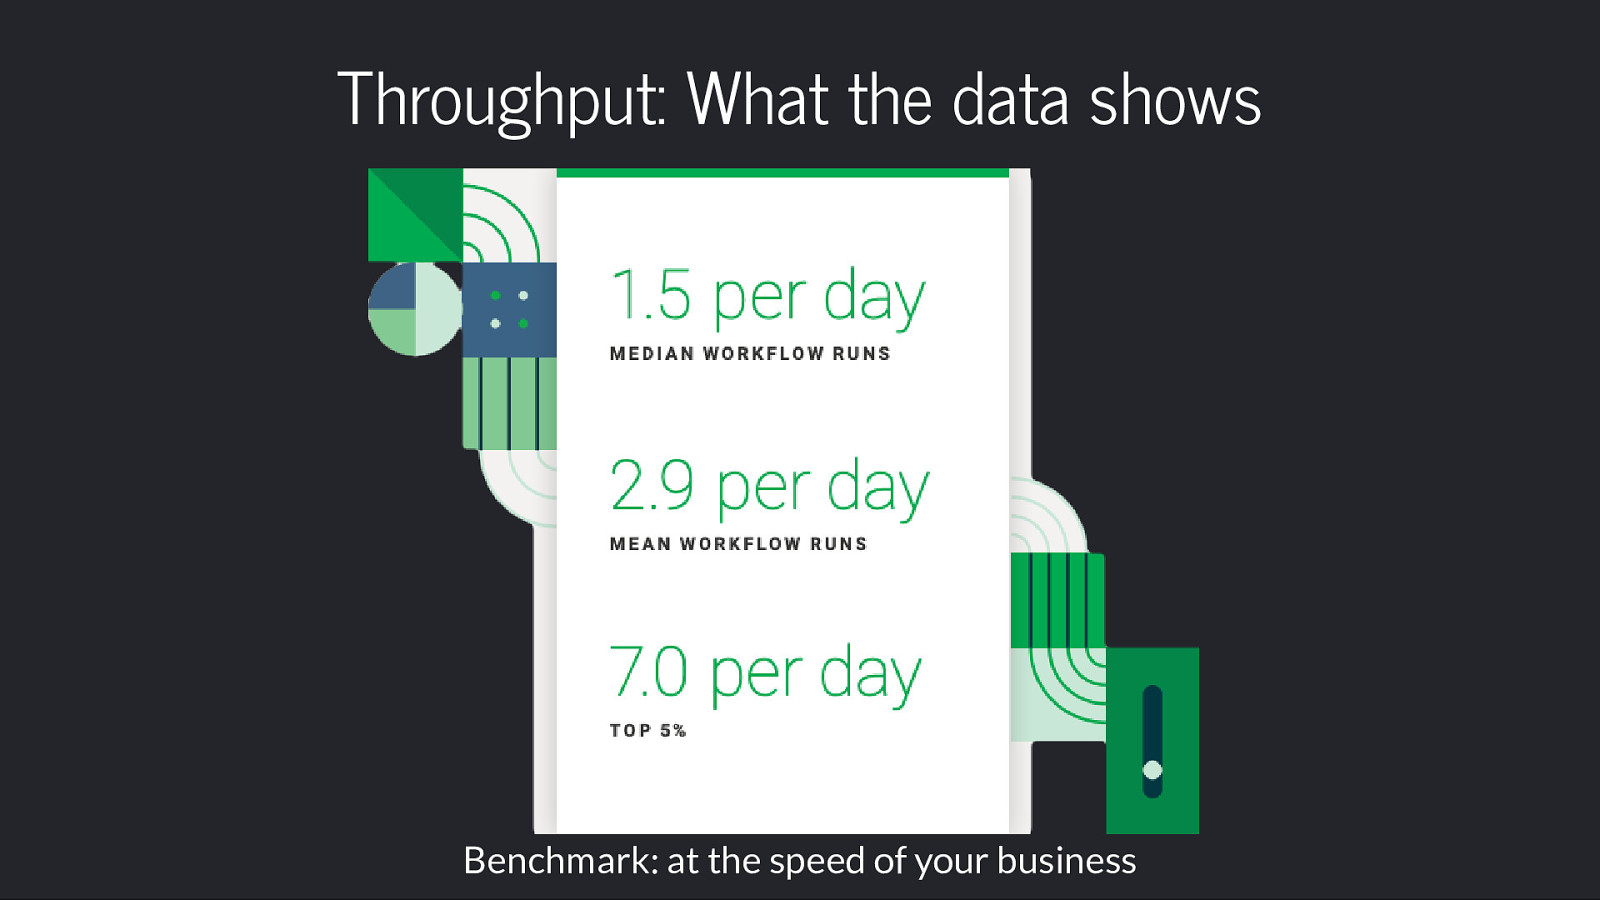
Throughput: What the data shows Benchmark: at the speed of your business
Slide 46

Slide 47

Slide 48
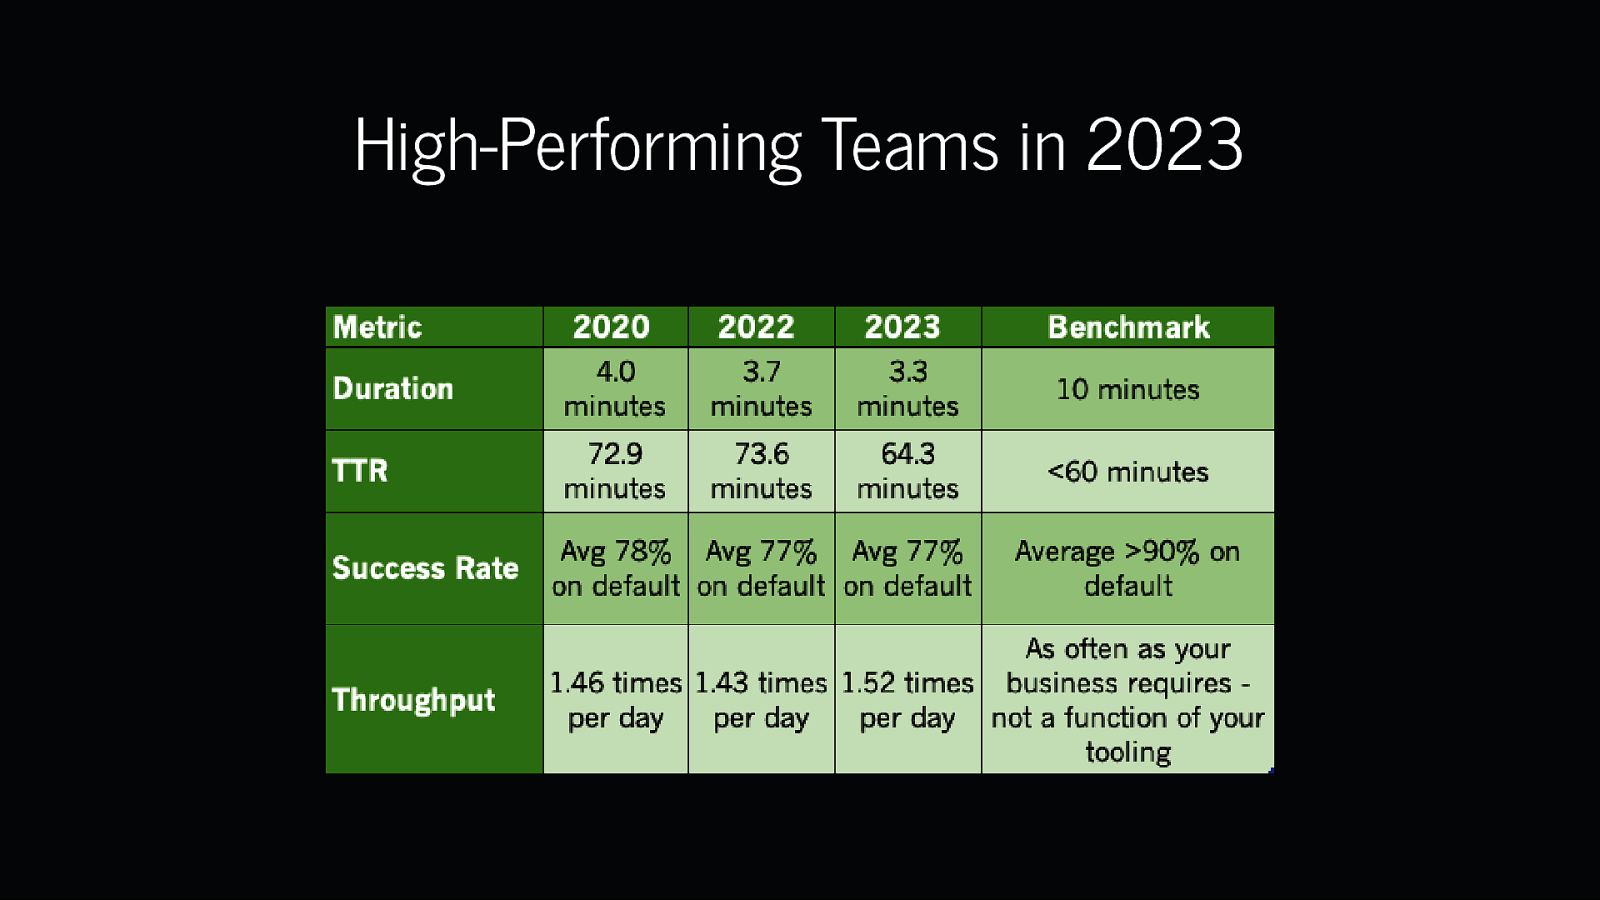
High-Performing Teams in 2023
Slide 49

Platform Teams, DevOps, and you
Slide 50
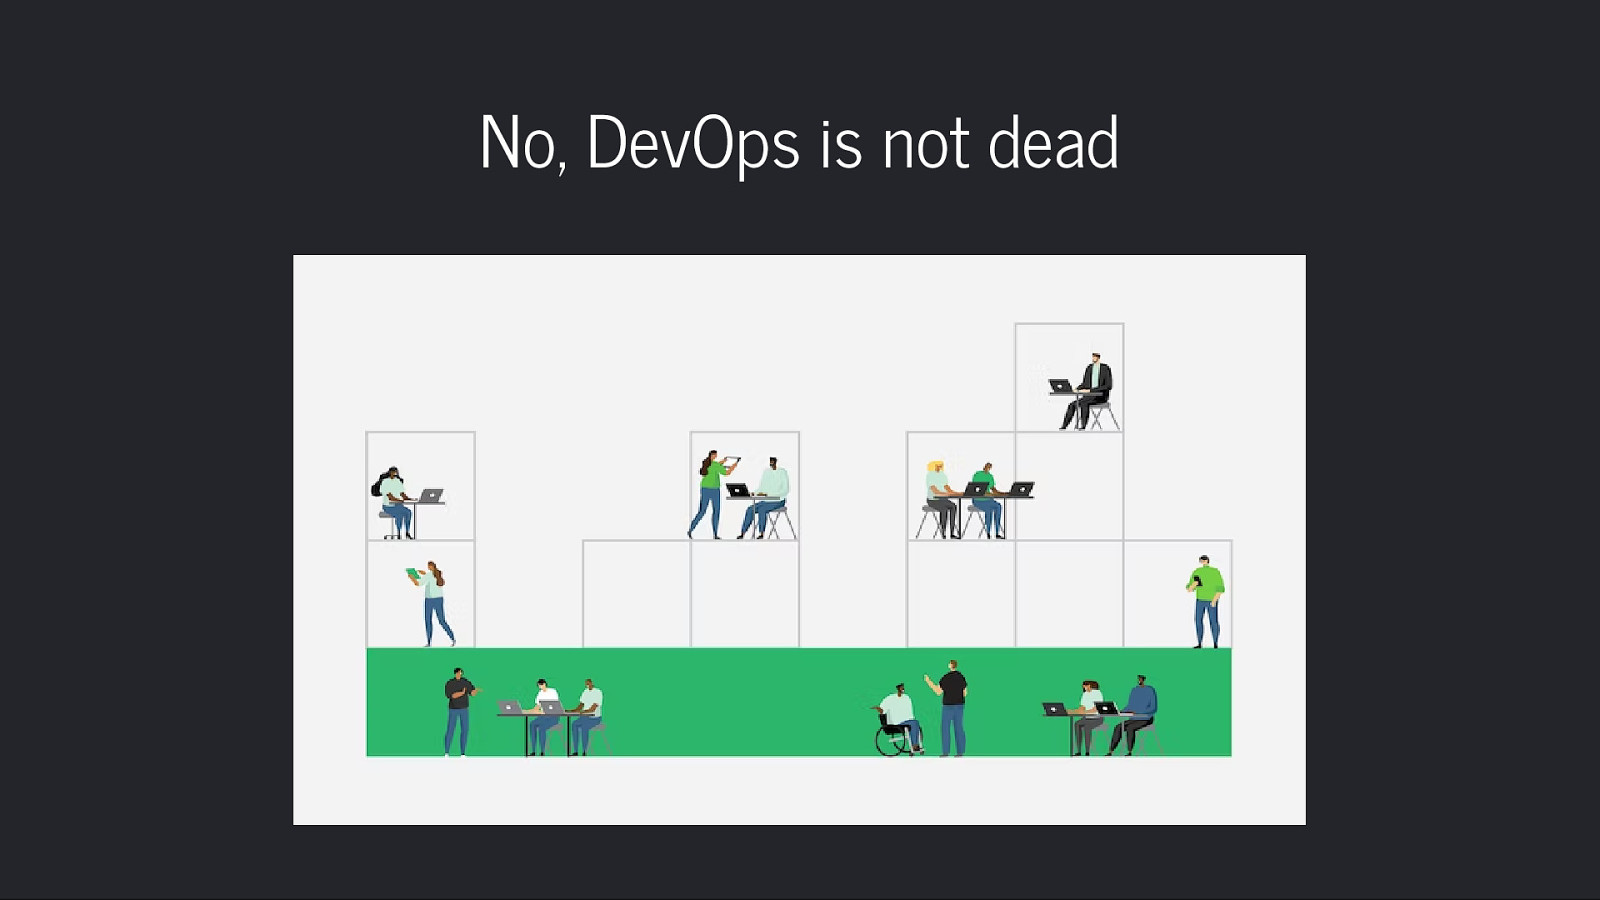
No, DevOps is not dead
Slide 51
Slide 52

The Rise of Platform Teams
Slide 53

Image credit: tsh.io
Slide 54
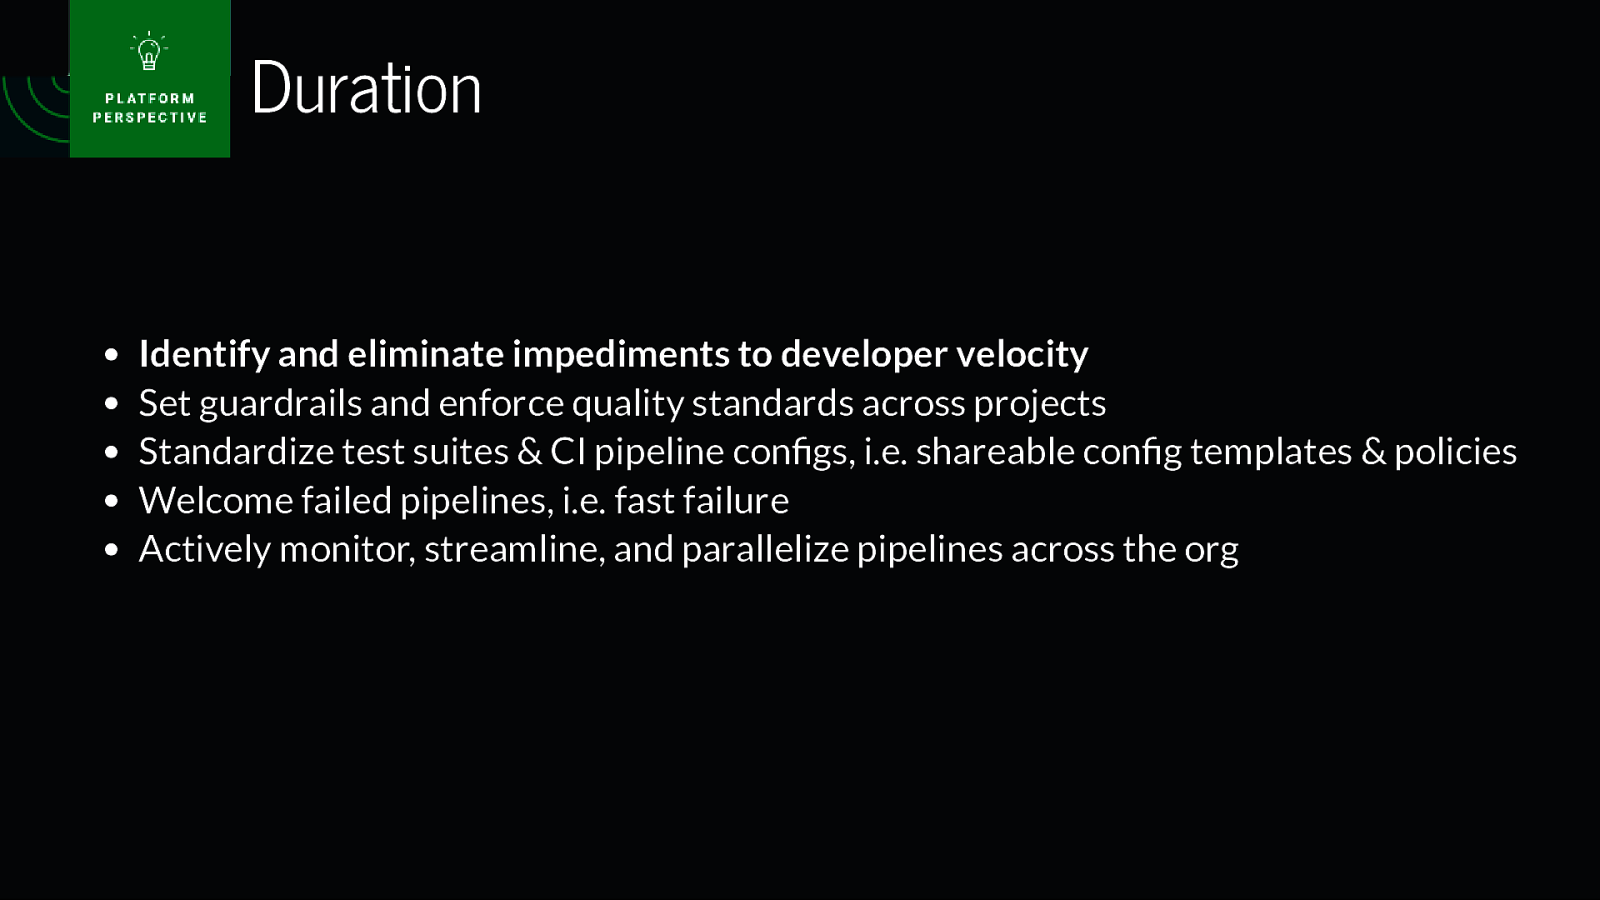
Duration Identify and eliminate impediments to developer velocity Set guardrails and enforce quality standards across projects Standardize test suites & CI pipeline configs, i.e. shareable config templates & policies Welcome failed pipelines, i.e. fast failure Actively monitor, streamline, and parallelize pipelines across the org
Slide 55
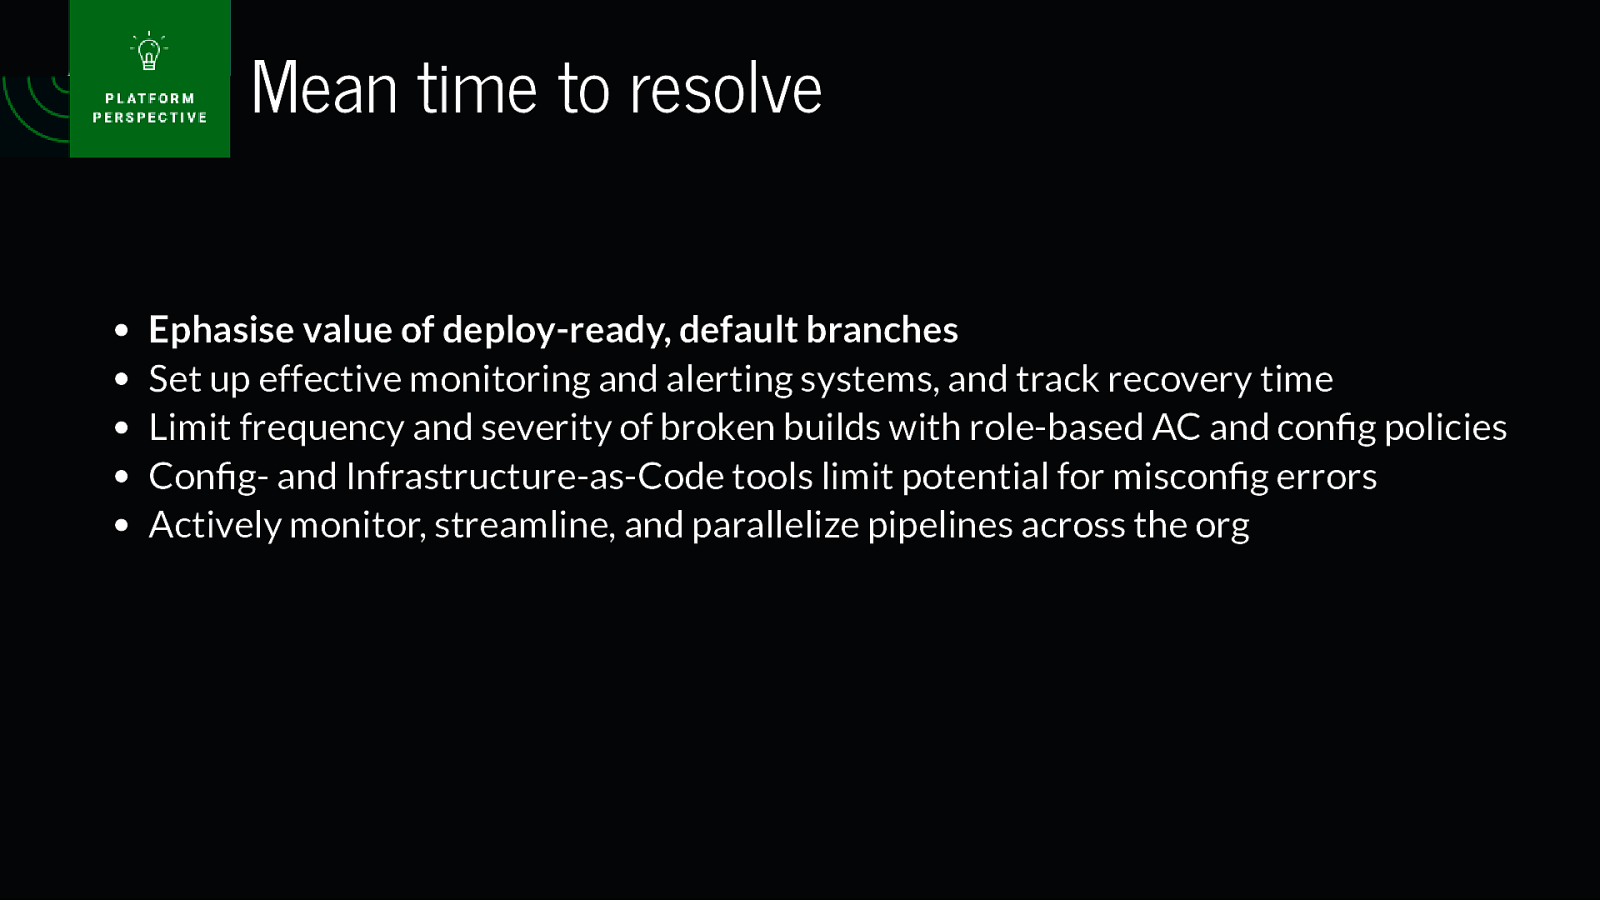
Mean time to resolve Ephasise value of deploy-ready, default branches Set up effective monitoring and alerting systems, and track recovery time Limit frequency and severity of broken builds with role-based AC and config policies Config- and Infrastructure-as-Code tools limit potential for misconfig errors Actively monitor, streamline, and parallelize pipelines across the org
Slide 56
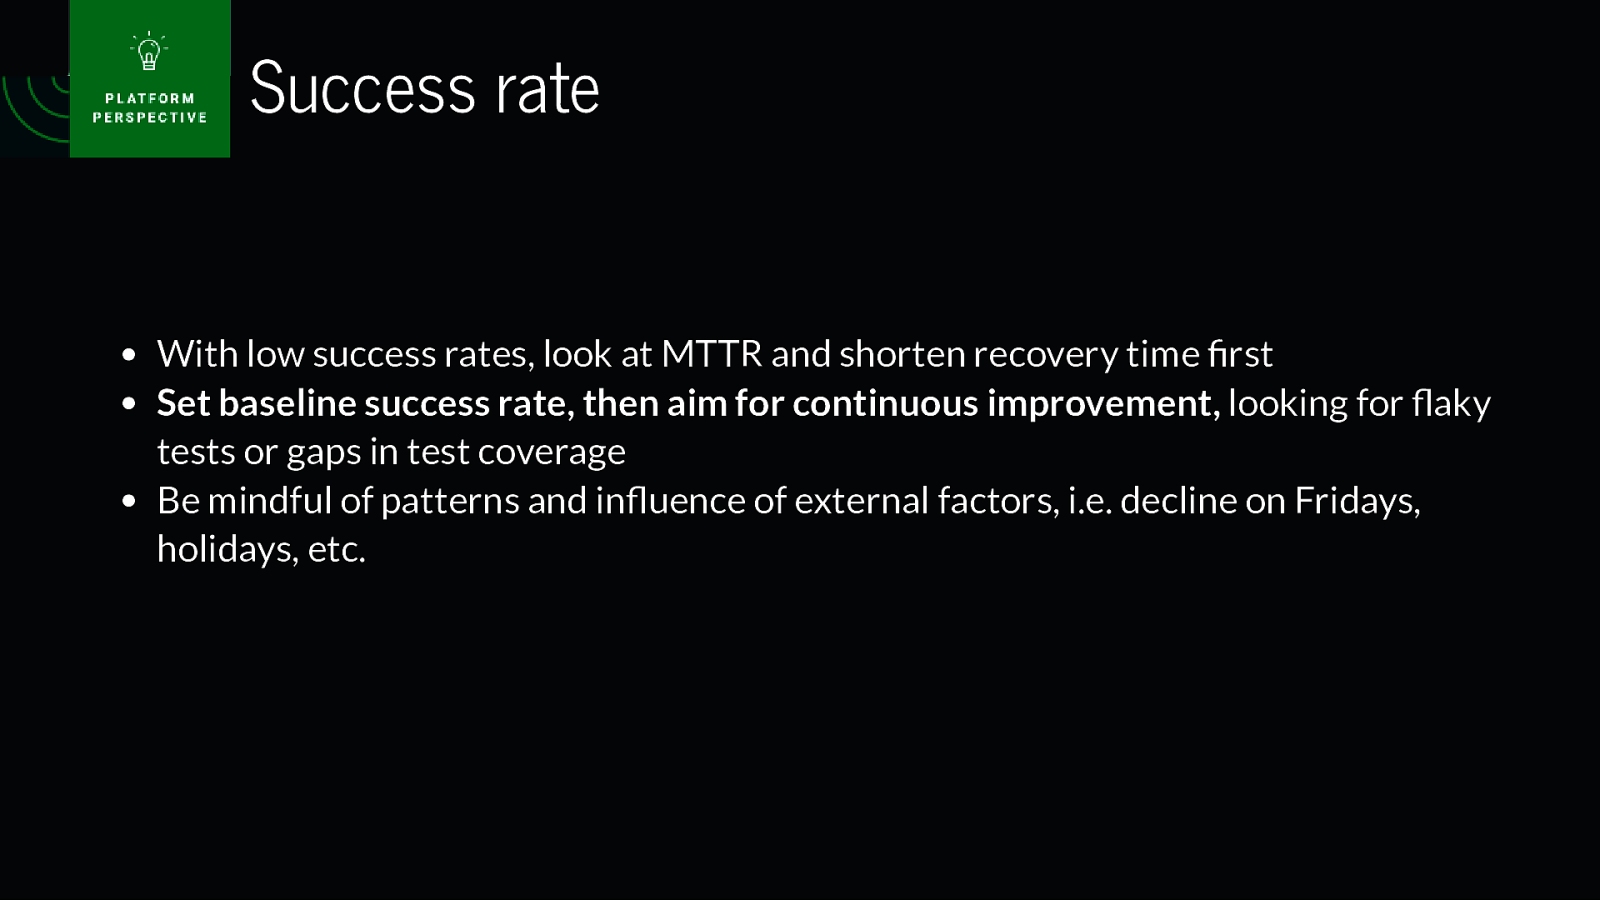
Success rate With low success rates, look at MTTR and shorten recovery time first Set baseline success rate, then aim for continuous improvement, looking for flaky tests or gaps in test coverage Be mindful of patterns and influence of external factors, i.e. decline on Fridays, holidays, etc.
Slide 57
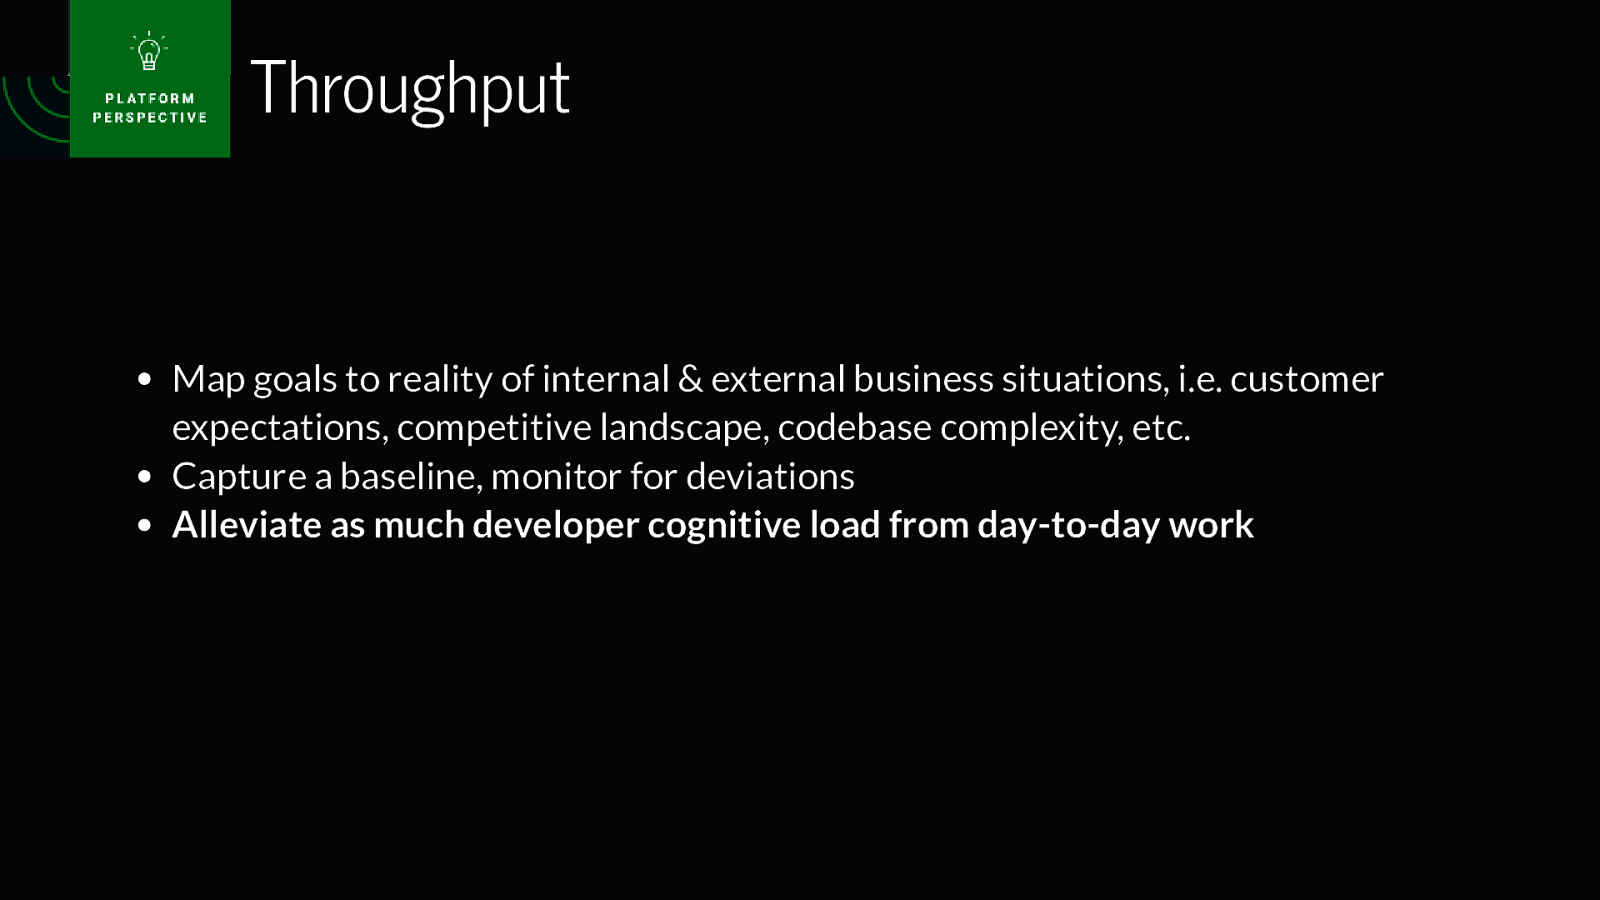
Throughput Map goals to reality of internal & external business situations, i.e. customer expectations, competitive landscape, codebase complexity, etc. Capture a baseline, monitor for deviations Alleviate as much developer cognitive load from day-to-day work
Slide 58

Almost done…. …but first a little more interesting data
Slide 59
Some Key Results We Found Largest productivity declines were concentrated around public holidays
Slide 60
Some Key Results We Found Largest productivity declines were concentrated around public holidays Major, nationally significant events resulted in localized productivity drops
Slide 61
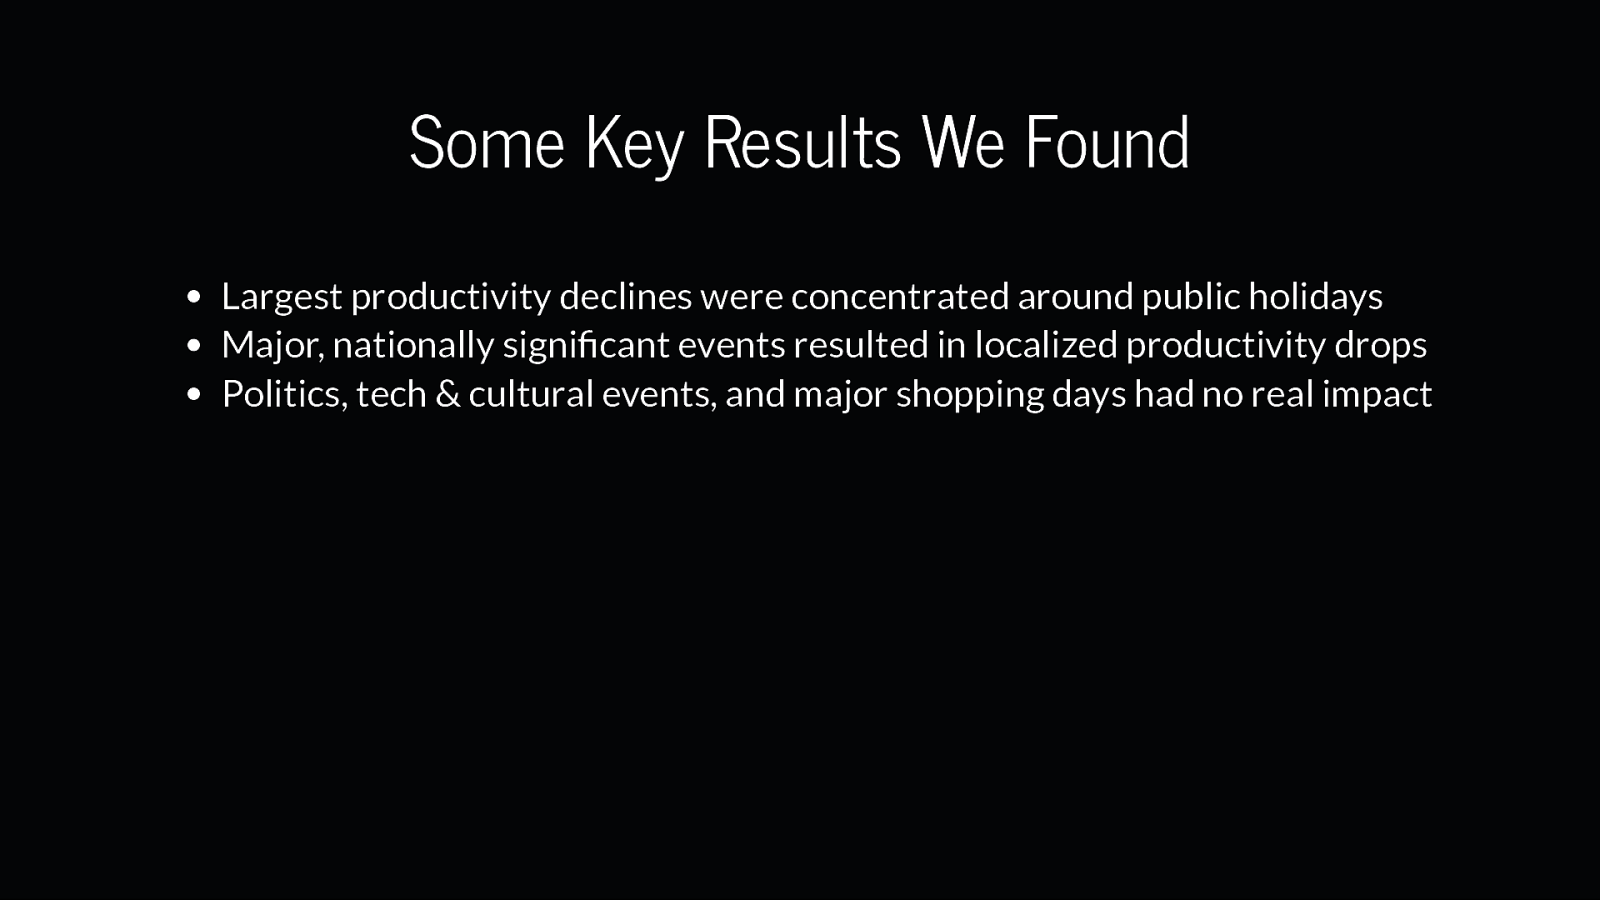
Some Key Results We Found Largest productivity declines were concentrated around public holidays Major, nationally significant events resulted in localized productivity drops Politics, tech & cultural events, and major shopping days had no real impact
Slide 62
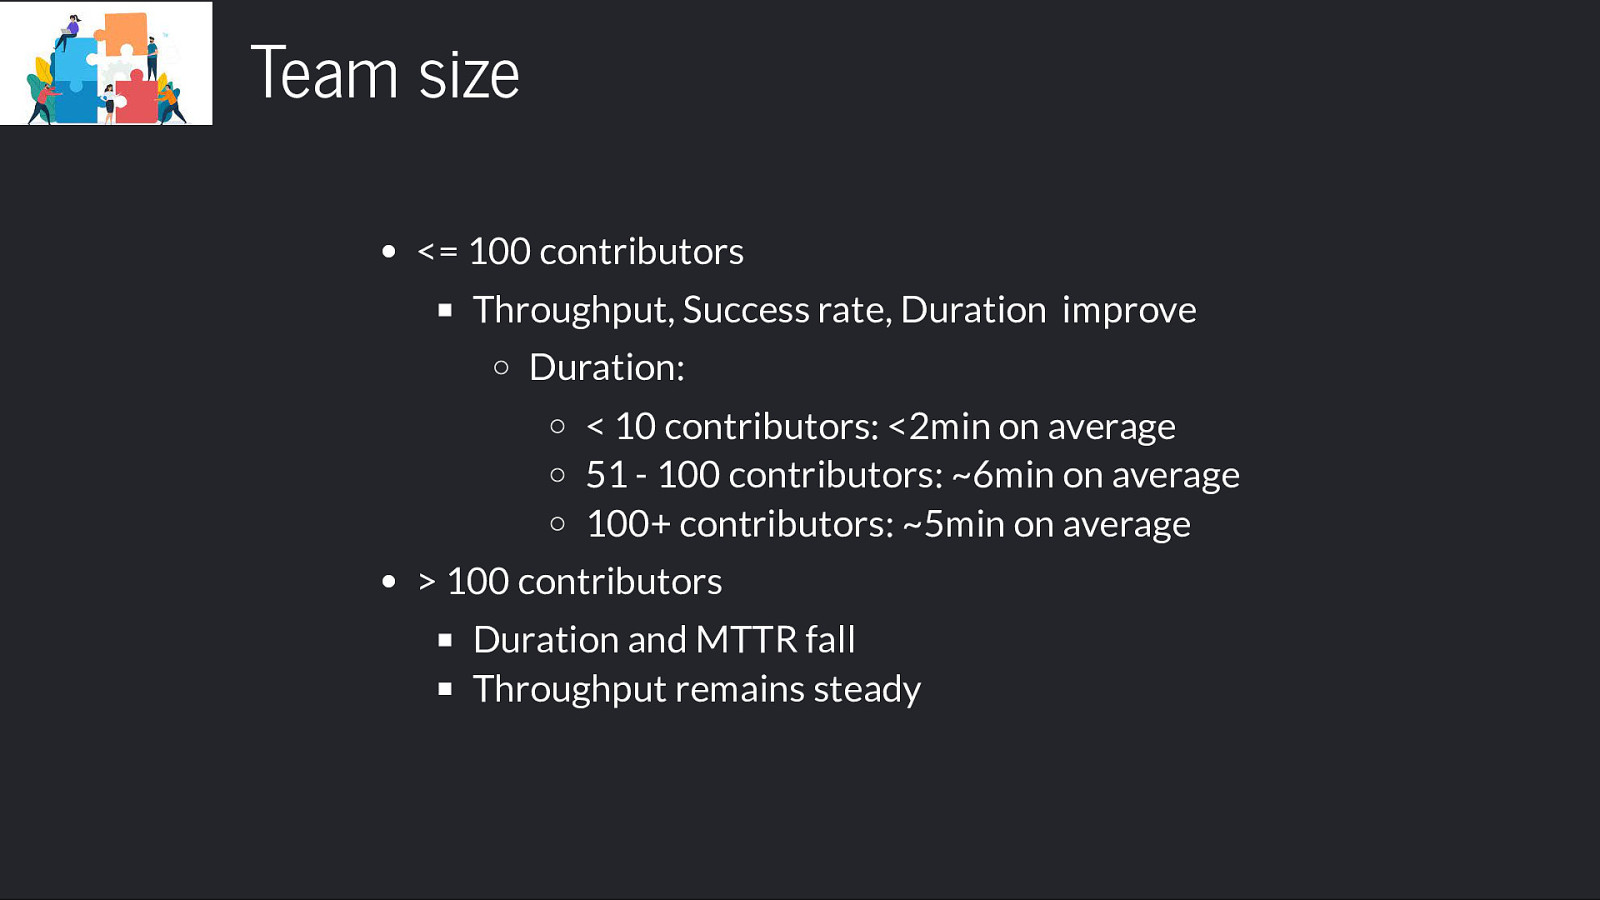
Team size <= 100 contributors Throughput, Success rate, Duration improve Duration: < 10 contributors: <2min on average 51 - 100 contributors: ~6min on average 100+ contributors: ~5min on average > 100 contributors Duration and MTTR fall Throughput remains steady
Slide 63
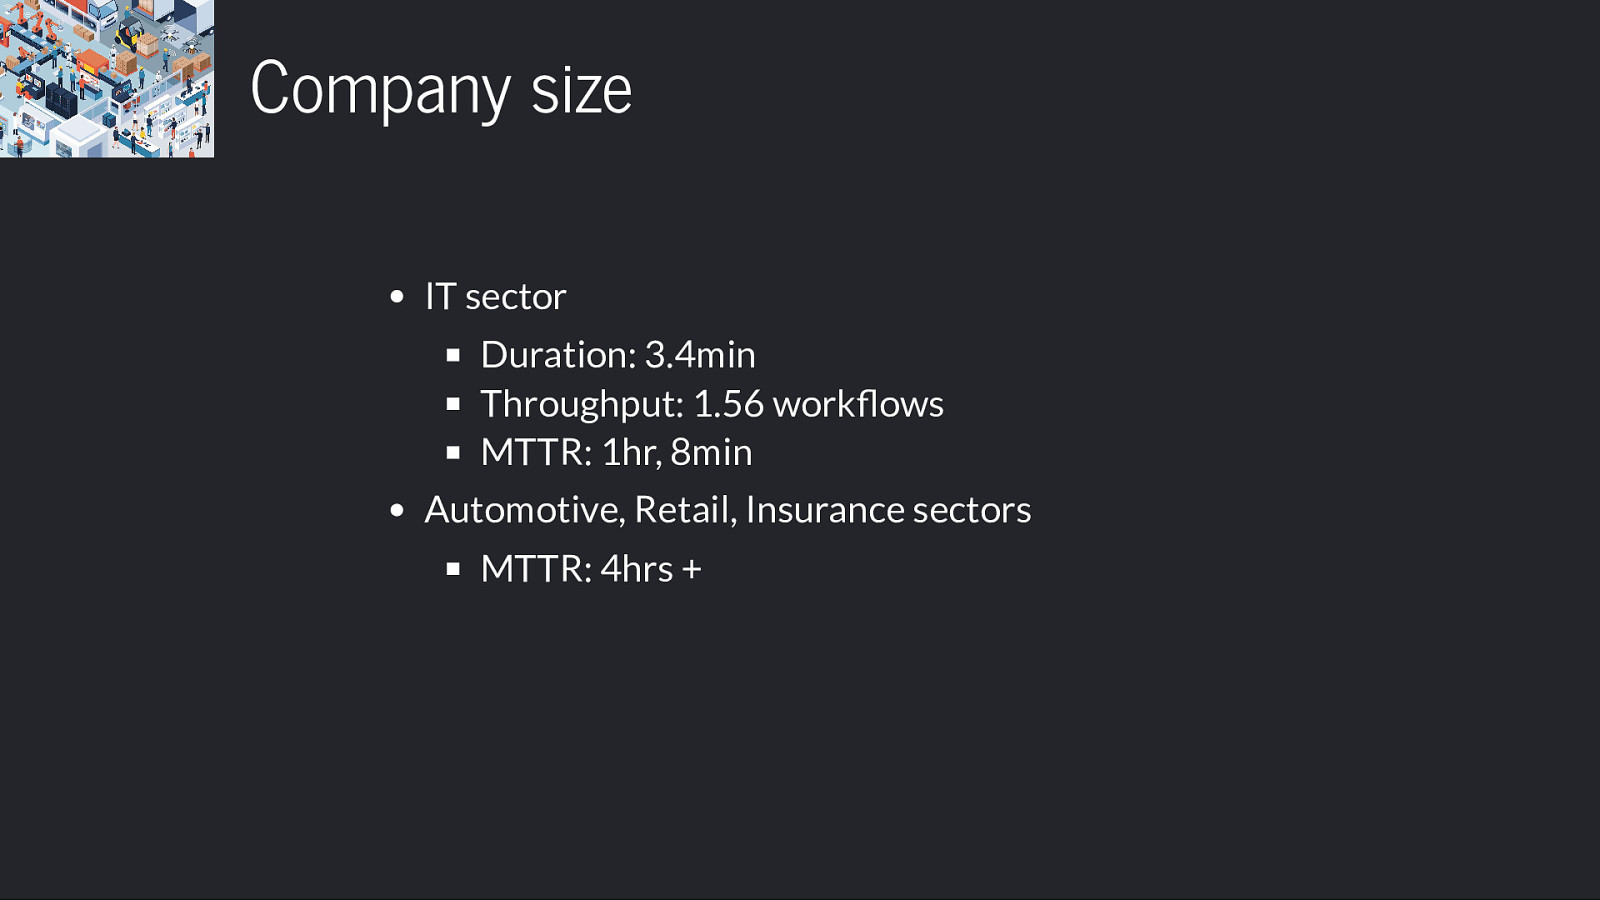
Company size IT sector Duration: 3.4min Throughput: 1.56 workflows MTTR: 1hr, 8min Automotive, Retail, Insurance sectors MTTR: 4hrs +
Slide 64

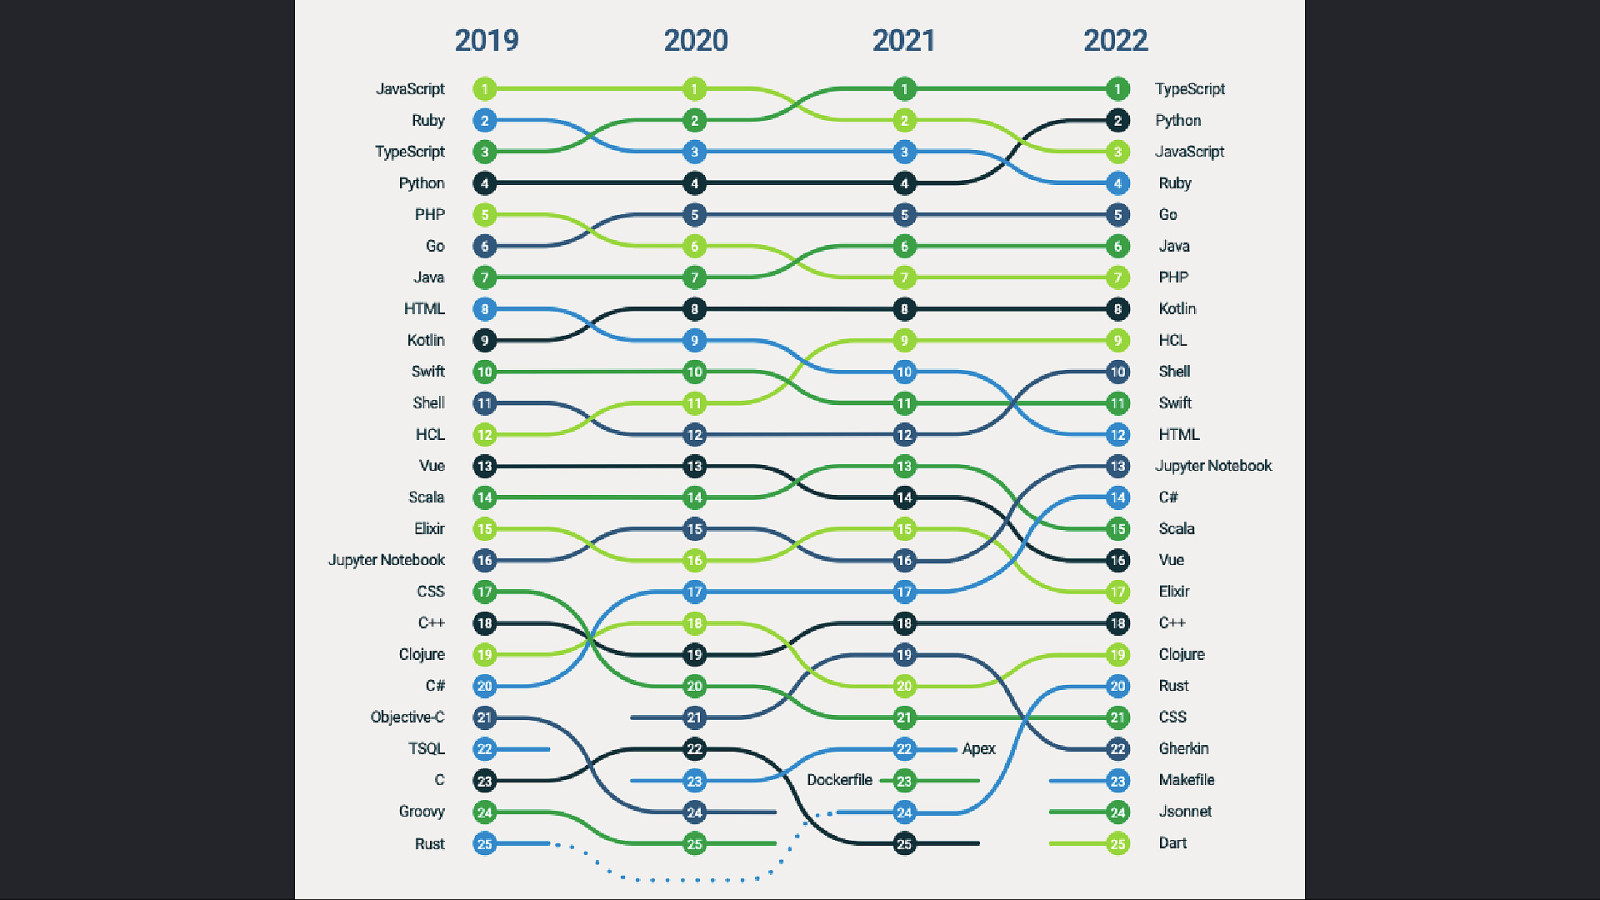
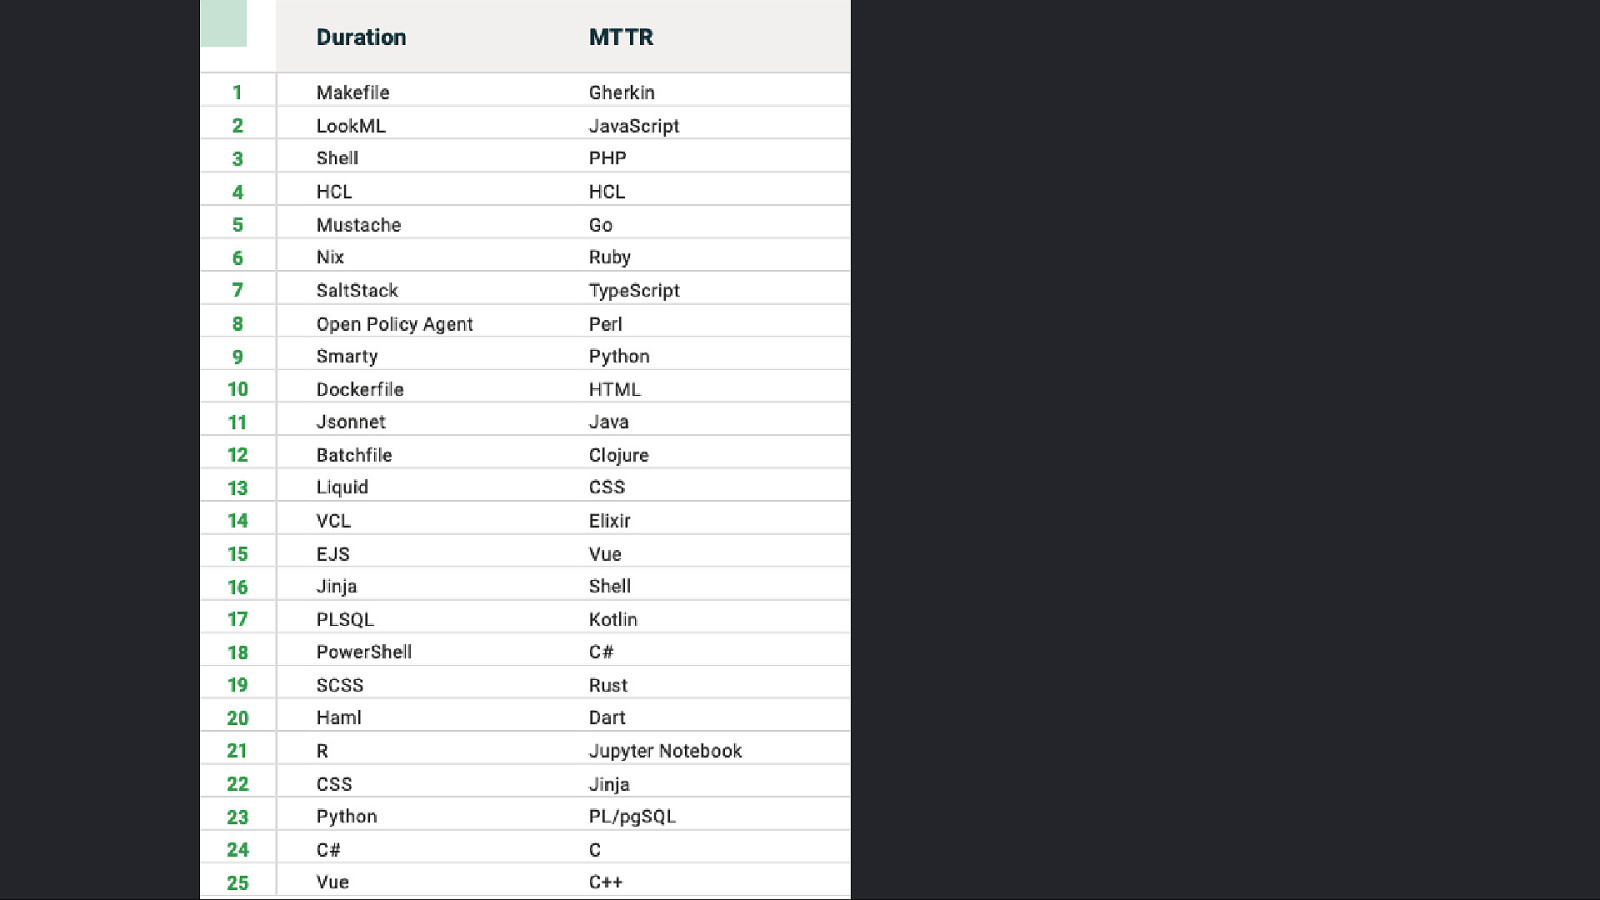
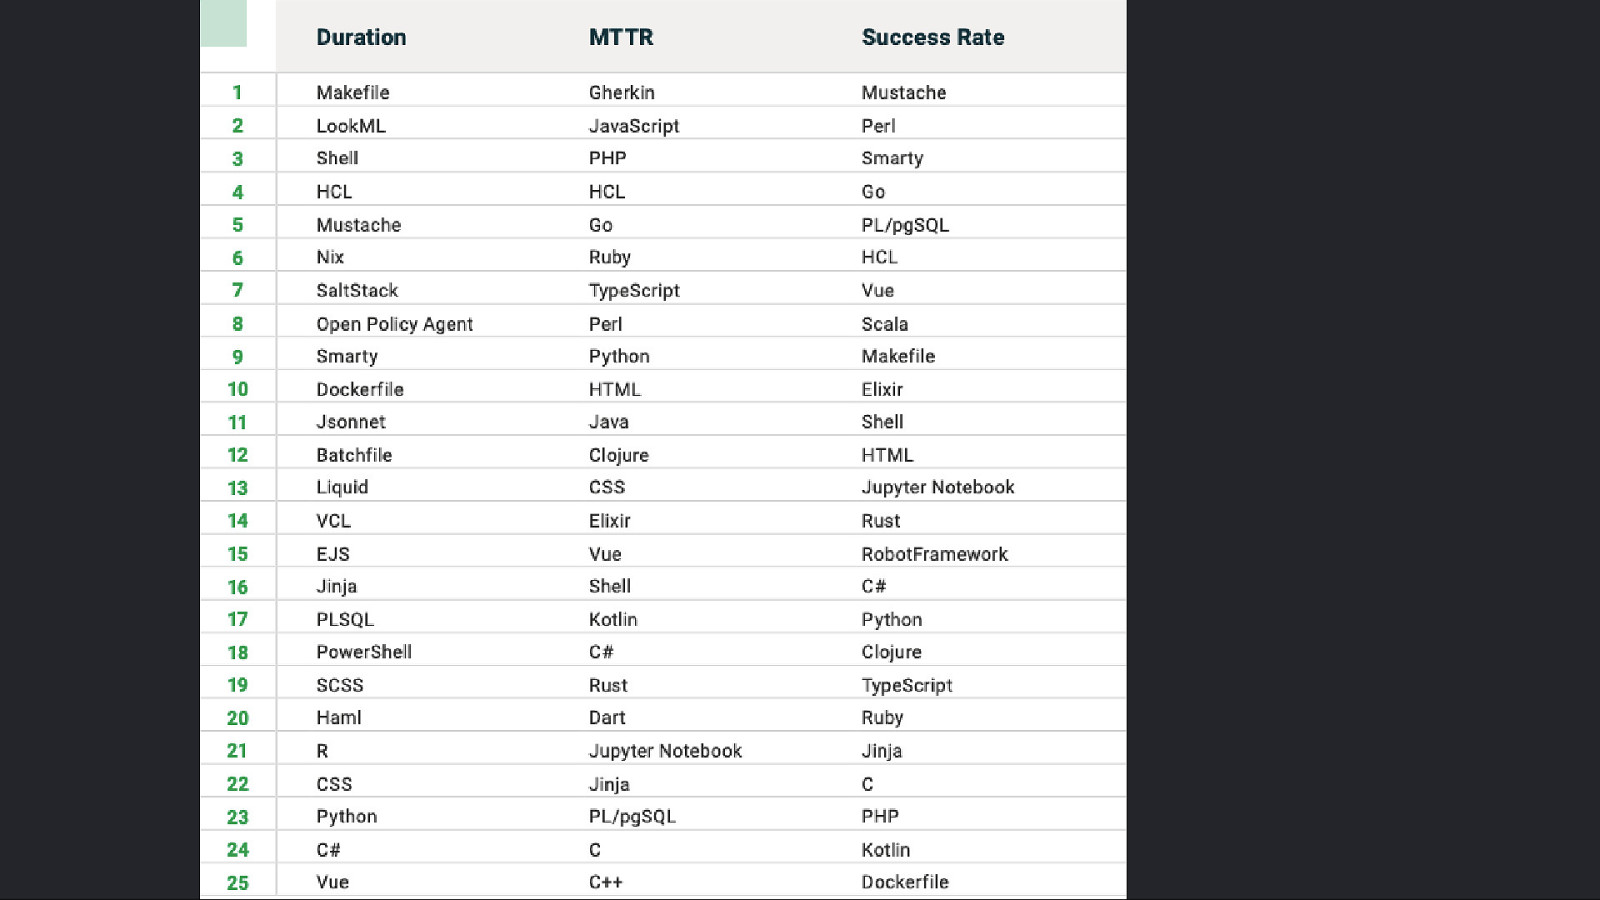
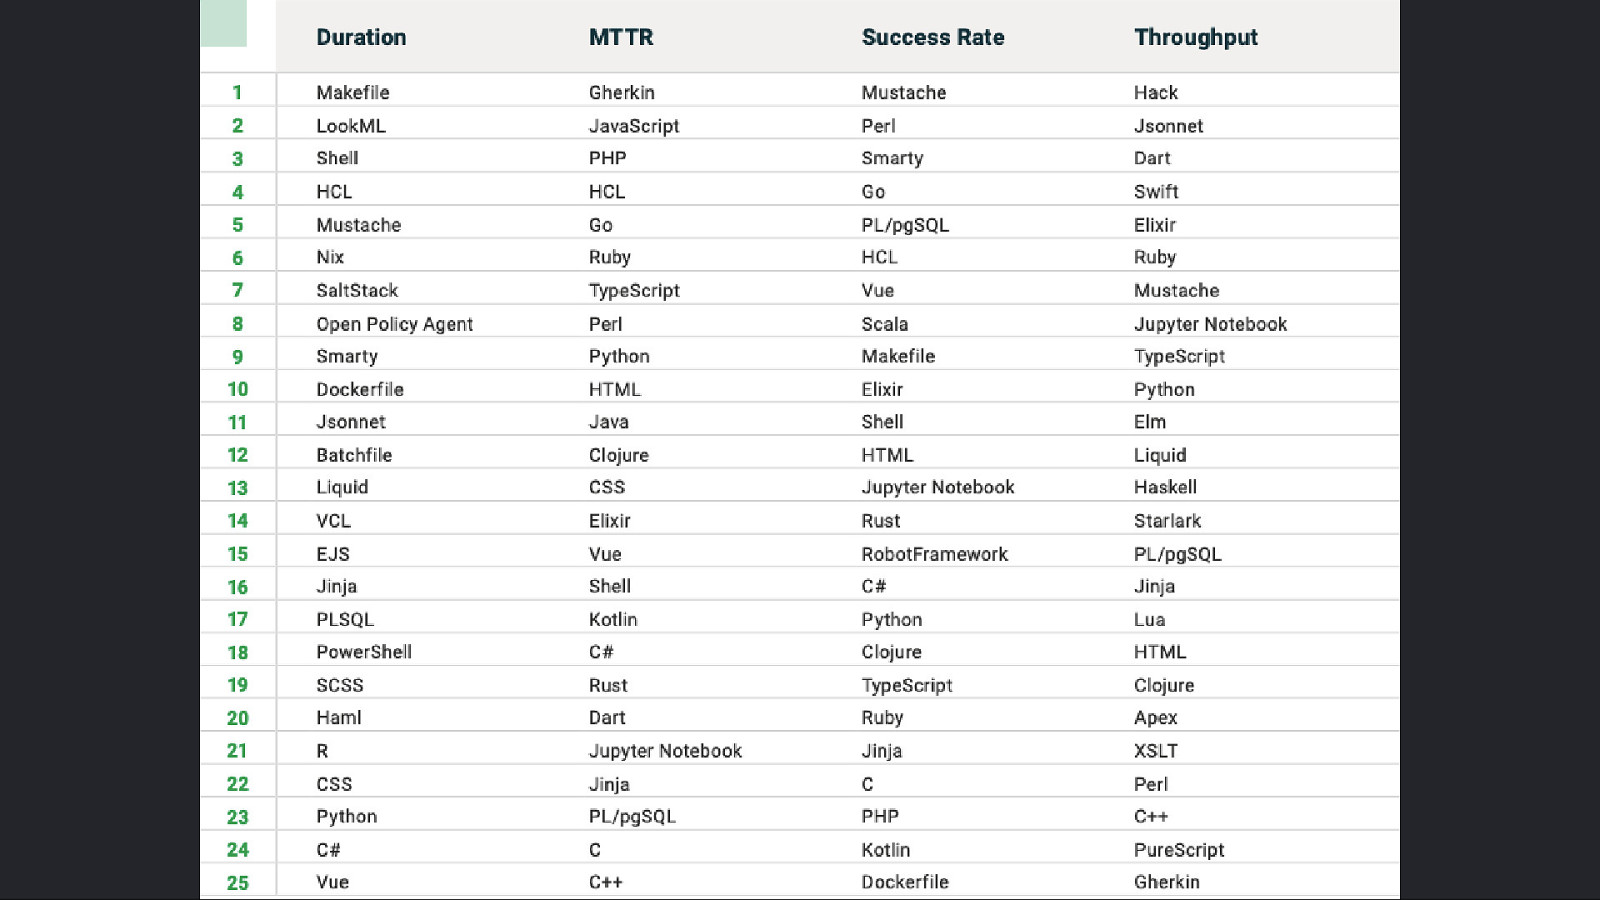
“Surely <insert programming language> helps me achieve the “Holy Grail”!?”
Slide 65
Slide 66

Slide 67
Slide 68
Slide 69
Slide 70

Slide 71

2023 State of Software Delivery Report circle.ci/sosdr2023
Slide 72
Thank You. timeline.jerdog.me IAmJerdog jerdog /in/jeremymeiss For feedback and swag: circle.ci/jeremy @jerdog@hachyderm.io